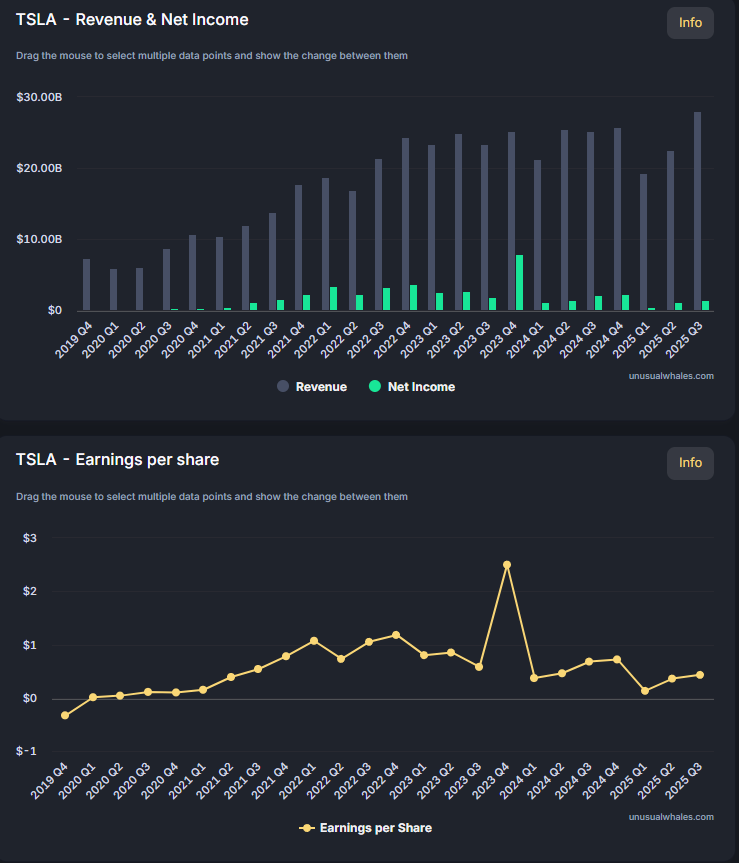
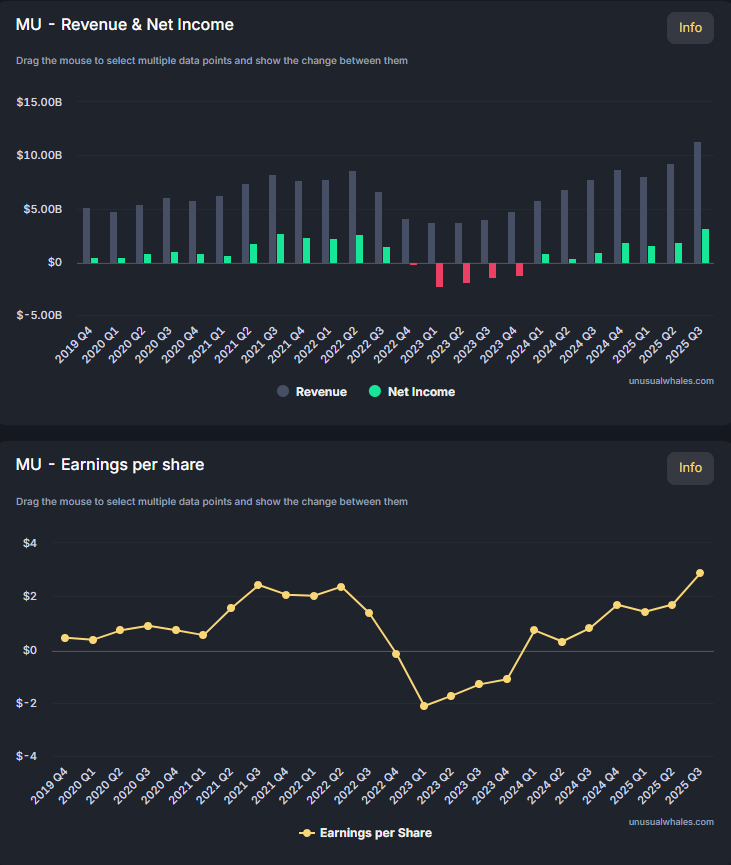
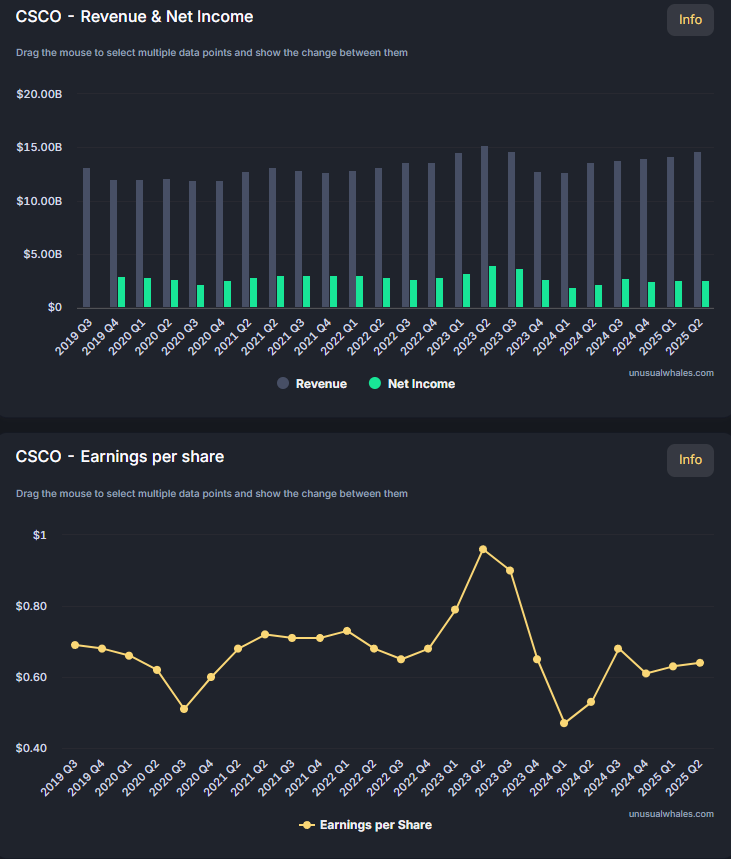
Apres une montée des cours spectaculaire, voyons si les revenus suivent ou decrochent .
Un cours qui prend 10% de cotation doit prendre 10% de revenus en plus, sous peine de voir son PER augmenter, ce qui le décorrèle de son marché et de ses fondamentaux – mais c’est aussi l’apanage des stars de la cotation comme Tesla, un espece de cote de popularité à defaut de représenter de vrais fondamentaux..
On voit vite que chaque secteur d’activité a ses stars (cote de popularité élevée) : chaque société qui s’est démarquée de sa concurrence a fait l’objet d’achats qui ont poussé sa cotation davantage que ses concurrents – donc clairement chaque star a le PER le plus élevé de son secteur.
On s’apercoit que si on est pressés niveau plus values, mieux vaut miser sur les stars que sur les sociétés ayant de bons fondamentaux, mais le niveau de risque va avec. Par ex sur un asset ayant de bons fondamentaux, on a pas le repli lié à la publication des mauvais earnings par rapport à la cotation en cours.
Ici on voit un calcul des earnings attendus pour les capitalisations actuelles des assets stars. J’ai l’impression que tant que de gros chiffres de progression de revenus sont annoncés (>20% par ex), c’est pas grave si le PER augmente.
Big Tech Earnings Preview: Tech Giants Need Major Earnings Leap to Justify Soaring Stocks
Big tech earnings season is approaching amid recent market turbulence due to aggressive tariff policies.
Considering that the stock market has been rising for several months, this earnings season poses a high threshold for various tech companies.
Given the substantial impact big tech companies have on major indices, their earnings reports could set the tone for investor sentiment and the overall direction of the market.
On October 22, $Tesla (TSLA.US)$ will be the first to release its earnings report, officially kicking off a new round of earnings season for U.S. tech stocks.
The company’s revenue is expected to be USD 26.58B for 2025 Q3, up 5.53% YOY; EPS is estimated to be USD 0.44, down 29.52% YOY (Year-Over-Year).
$NVIDIA (NVDA.US)$ stands out with expected revenue growth of 55.74% and EPS growth of 52.96%, signaling continued robust demand for AI technologies.

The cloud business has been one of the most closely watched sectors for $Amazon (AMZN.US)$, $Microsoft (MSFT.US)$, Google, and $Oracle (ORCL.US)$ in recent years.
The demand for AI computing power from enterprises has kept cloud services growing at a high rate.
In the last quarter, the most prominent cloud computing companies, Oracle and Microsoft, saw their cloud business revenues increase by 52% and 39%, respectively. Only Amazon’s cloud business had a year-over-year growth rate below 20%. The market still expects other companies, besides Amazon, to maintain momentum in their cloud businesses this quarter.
Additionally, we need to pay attention to the capital expenditures of the four major cloud vendors. The capital expenditure forecasts provided by these companies will be evident not only in the gross profit margins of their cloud businesses in the second-quarter reports but will also showcase the enterprises’ confidence in the AI sector. This, in turn, will directly impact the stock performance of chip manufacturers like Nvidia and $Broadcom (AVGO.US)$.
AI Chips
$Advanced Micro Devices (AMD.US)$ and Nvidia will announce their financial results after the market closes on November 4th and November 9th, respectively. Recent close industry collaborations and capacity layouts in the AI sector have brought new momentum to the chip segment. Concerns about market share have put pressure on Nvidia’s stock price recently. In contrast, AMD’s stock price has surged continuously due to its collaboration with OpenAI. However, order allocations and capacity restrictions at TSMC could potentially limit the actual shipment volumes of chips.
Market expectations are for AMD’s revenue to grow by 28.12% and EPS by 43.79%. For Nvidia, the expected revenue growth is 55.74% and EPS growth is 52.96%, suggesting that the market anticipates Nvidia’s market share is still expanding.
Broadcom has not yet announced the date for their earnings report. The market consensus forecasts a 24.16% increase in revenue and a 24.67% increase in EPS.
Digital Ads
At present, AI-powered advertising tools provide comprehensive campaign management features including audience targeting, ad placement, and creative optimization.
Data indicates that the use of $Alphabet-A (GOOGL.US)$ ’s Performance Max (PMax) and $Meta Platforms (META.US)$ ’s Advantage+ by advertisers has steadily increased, continually enhancing both platforms. This trend is especially significant as advertisers increasingly prioritize large-scale, high-quality platforms renowned for their strong performance.
The market expects Google’s total revenue growth rate to be 13.22% and EPS growth rate to be 8.25%; for Meta, the anticipated total revenue growth rate is 21.65% and EPS growth rate is 11.20%.

Hardware
$Apple (AAPL.US)$ ‘s smartphone sales rebounded in the third quarter. According to the latest research from technology consulting firm Omdia, the global smartphone market grew by 3% year-over-year in the third quarter of 2025. This indicates that the market regained momentum due to strong demand for product upgrades driven by major product launches within the quarter. Omdia’s report shows that iPhone shipments increased by 4% year-over-year. With strong initial demand following the launch of the iPhone 17 series, Apple captured 18% of the global market share. Bloomberg consensus estimates expect Apple’s adjusted EPS growth rate to be 7.57%.
Source: Omdia
article: https://www.moomoo.com/news/post/59879987/big-tech-earnings-preview-tech-giants-need-major-earnings-leap

Apres l’article, un peu de travail de ma part : 6H de prompts et de récupération d’infos plus tard (je marque ca ici parce que je pense que dans 1an ,tout ca se fera en 10min), voici le résultat :
Tech Giants : EBITDA, Résultat net & PER (FY2022–FY2024)
Comparatif des géants technologiques (TSLA, GOOGL, MSFT, META, AAPL, AMZN, AMD, NVDA, AVGO, ORCL).
Chiffres en milliards USD. Δ EBITDA = variation absolue (en Md$) d’une année sur l’autre.
| Ticker | EBITDA 2022 | EBITDA 2023 | EBITDA 2024 | Δ EBITDA 23–22 |
Δ EBITDA 24–23 |
NI 2022 | NI 2023 | NI 2024 | PER 2022 | PER 2023 | PER 2024 |
|---|---|---|---|---|---|---|---|---|---|---|---|
| TSLA | 17.40 | 13.56 | 12.44 | -3.84 | -1.12 | 12.59 | 14.999 | 7.13 | 30.6 | 52.6 | 181.0 |
| GOOGL | 88.32 | 96.24 | 127.70 | 7.92 | 31.46 | 59.97 | 73.80 | 100.12 | 19.2 | 23.9 | 23.4 |
| MSFT | 97.84 | 102.38 | 131.72 | 4.54 | 29.34 | 72.70 | 72.40 | 88.14 | 26.0 | 33.4 | 33.6 |
| META | 37.63 | 57.93 | 84.88 | 20.30 | 26.95 | 23.20 | 39.10 | 62.36 | 13.9 | 23.2 | 23.8 |
| AAPL | 130.54 | 125.82 | 134.66 | -4.72 | 8.84 | 99.80 | 96.99 | 93.74 | 21.6 | 29.6 | 39.5 |
| AMZN | 54.17 | 85.52 | 121.39 | 31.35 | 35.87 | -2.72 | 30.43 | 59.25 | -313.0 | 51.3 | 38.8 |
| AMD | 5.72 | 3.96 | 5.08 | -1.76 | 1.12 | 2.65 | 0.85 | 1.64 | 72.8 | 283.0 | 118.0 |
| NVDA | 11.22 | 5.77 | 34.48 | -5.45 | 28.71 | 11.00 | 4.37 | 29.76 | 61.3 | 65.1 | — |
| AVGO | 19.20 | 20.04 | 23.47 | 0.84 | 3.43 | 11.22 | 14.08 | 5.90 | 19.6 | 32.3 | 182.0 |
| ORCL | 14.05 | 19.20 | 21.49 | 5.15 | 2.29 | 6.72 | 8.50 | 10.47 | 23.9 | 27.7 | 39.4 |
Notes : Les exercices fiscaux varient selon les sociétés. EBITDA et NI (Net Income ou résultat net) en GAAP.
Le PER correspond au P/E de fin d’année (end-of-year). NVDA 2024 : PER non disponible sur la source retenue (laissé « — »).
Key Insights
- Meta and Nvidia saw the largest EBITDA and earnings growth—both more than doubled from FY2022 to FY2024.
- Amazon rebounded sharply from a FY2022 net loss to strong profitability (+2276% NI growth).
- Tesla and AMD experienced declines in both EBITDA and earnings.
- Apple remained stable, with minimal EBITDA change and a modest drop in net income.
- Oracle and Google delivered solid double-digit growth in both metrics.
EBITDA and Net Income sourced from company filings and Macrotrends; Amazon 2024 net income confirmed via investor relations. EBITDA is a non-GAAP measure derived from operating income plus depreciation and amortization.
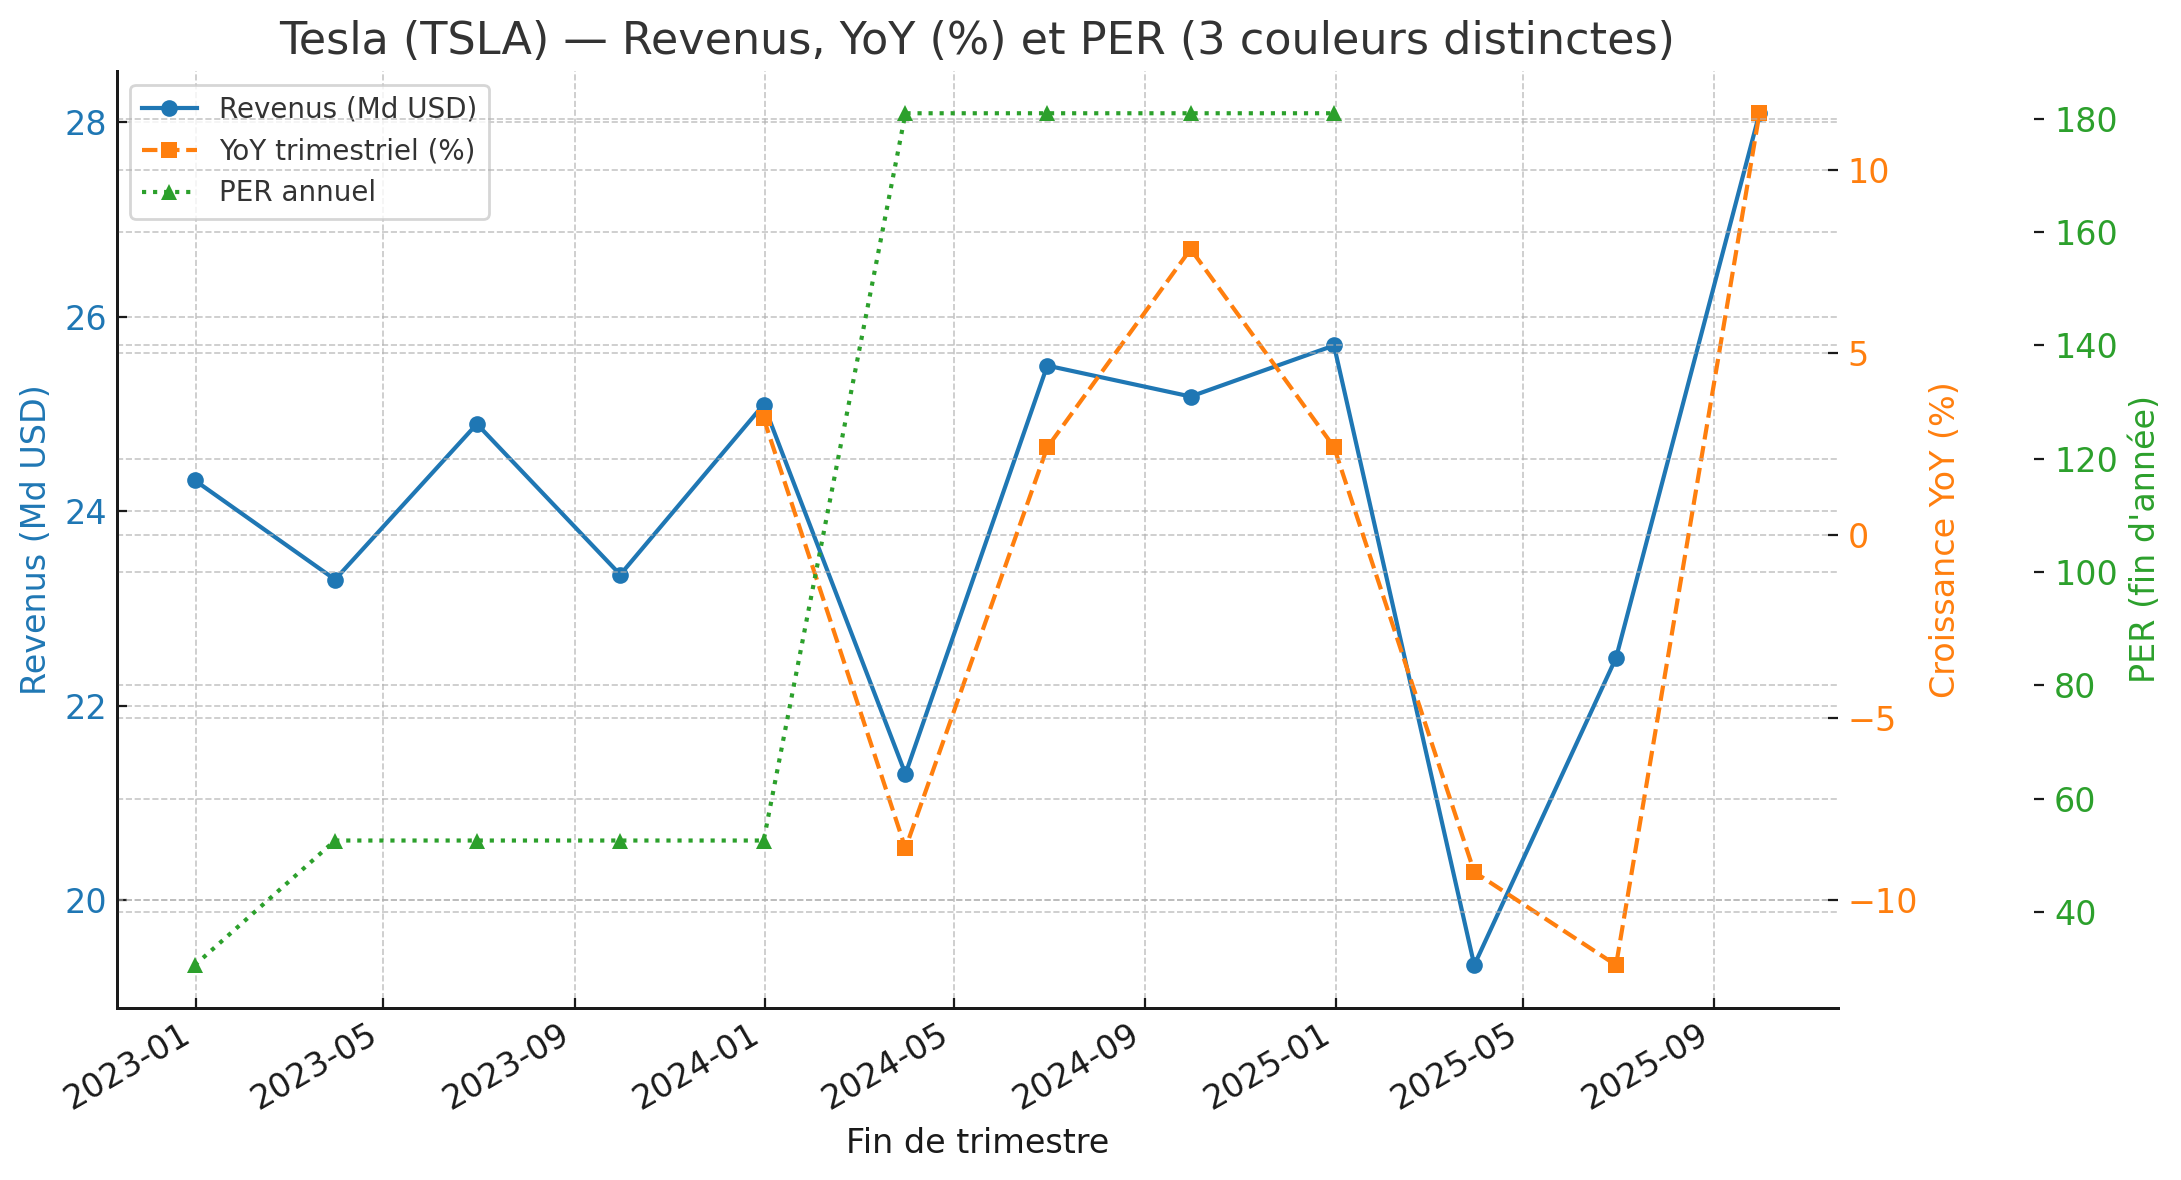
Points clés & sources (revenu total trimestriel)
- Q3 2025 = 28,1 Md$ (CNBC – augmentation de 12% YoY après 2 trimestres de baisse). CNBC
- Q2 2025 = 22,5 Md$ (Tesla Q2 Update, baisse de 12% YoY). Tesla/CNBC
- Q1 2025 = 19,3 Md$ (SEC Form 8-K, baisse de 9% YoY). SEC
- Q4 2024 = 25,7 Md$ (SEC communiqué, hausse de 2% YoY). CNBC/Electrek
- Q3 2024 = 25,2 Md$ (Quarter Results, hausse de 7,85% YoY). Quarter-Results
- Q2 2024 = 25,5 Md$ (Electrek/Tesla Update). Electrek
- Q1 2024 = 21,3 Md$ (SEC/Tesla Q1 Update). SEC
- Q4 2023 = ~25,2 Md$ (basé sur croissance YoY Q4 2024). [Calcul indirect]
- Q3 2023 = ~23,3 Md$ (basé sur croissance YoY Q3 2024). [Calcul indirect]
- Q2 2023 = 24,9 Md$ (CNBC – revenus de 24,93 Md$). CNBC
- Q1 2023 = 23,3 Md$ (CNBC/Teslarati – croissance de 24% YoY). CNBC/Teslarati
- Q4 2022 = 24,3 Md$ (CNBC – revenus de 24,32 Md$). CNBC
- Q3 2022 = ~19,0 Md$ (estimation basée sur données annuelles)
- Q2 2022 = ~20,0 Md$ (estimation basée sur données annuelles)
- Q1 2022 = ~18,8 Md$ (référencé dans Q1 2023 – 18,76 Md$). Nasdaq
PER annuel (EOY)
- 2024: 181,57 (Stock-Analysis-on.net). Stock-Analysis
- 2023: 40,55 (Stock-Analysis-on.net). Stock-Analysis
- 2022: 43,65 (Stock-Analysis-on.net). Stock-Analysis
Notes:
- Les revenus Tesla montrent une volatilité importante avec des baisses en 2025 après une période de croissance
- Le PER de Tesla est nettement plus élevé que celui d’Apple, reflétant les attentes de croissance du marché
- Les revenus incluent les ventes automobiles, l’énergie et le stockage, et les services
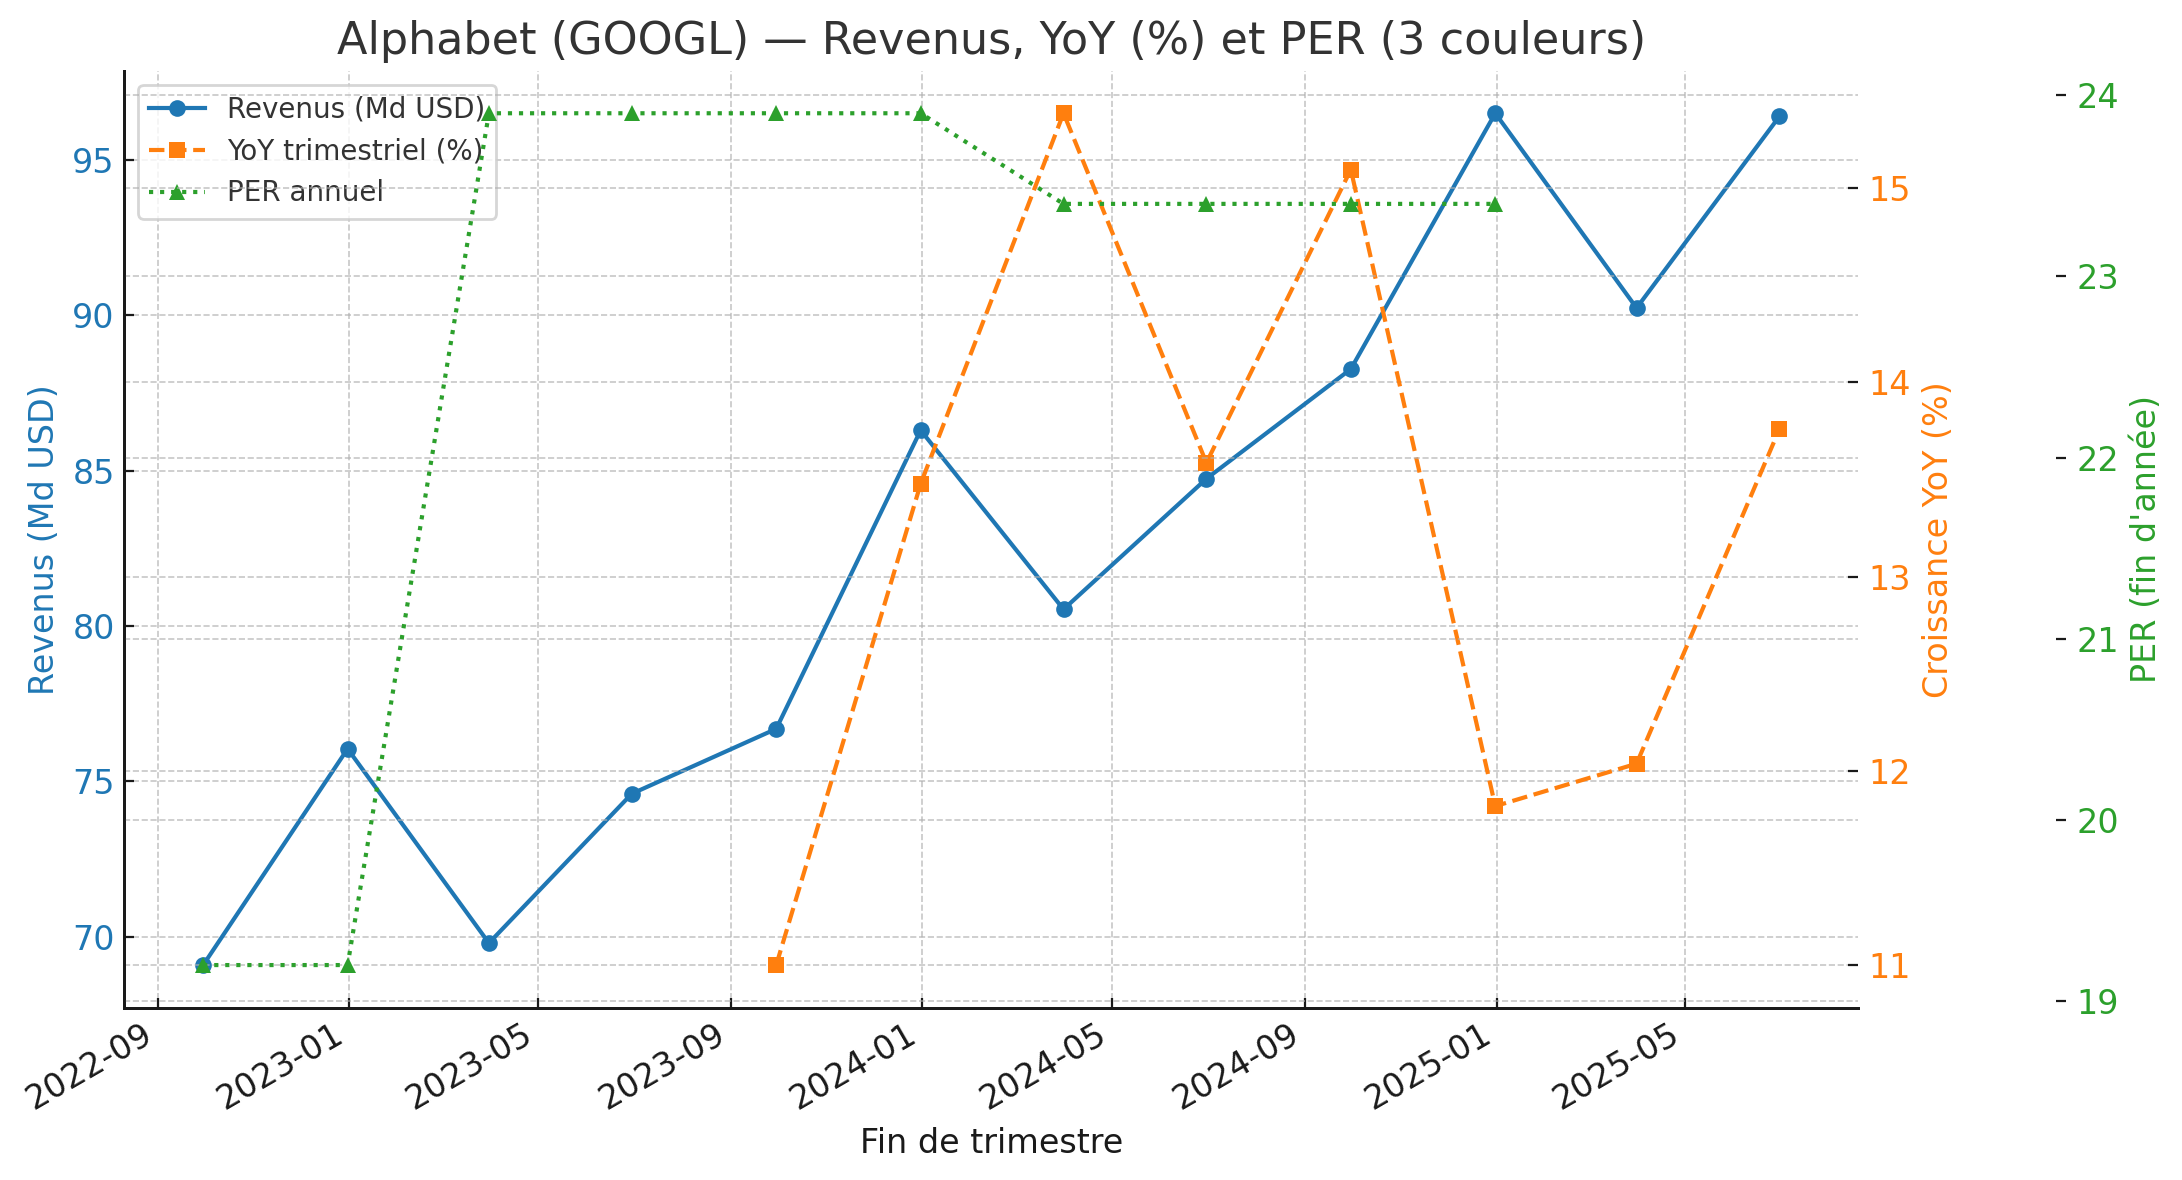
Points clés & sources (revenu total trimestriel)
-
Q2 2025 = 96,4 Md$ (SEC communiqué PDF). s206.q4cdn.com
-
Q1 2025 = 90,234 Md$ (SEC communiqué, avec tableau comparatif Q1 2024). SEC
-
Q4 2024 = 96,5 Md$ (SEC communiqué). SEC
-
Q3 2024 ≈ 88,27 Md$ (MarketBeat / presse; Fortune arrondit 88,3 Md$). MarketBeat+1
-
Q2 2024 = 84,74 Md$ (MarketBeat / récapitulatif résultats). MarketBeat
-
Q1 2024 = 80,539 Md$ (tableau SEC dans Q1 2025 release). SEC
-
Q4 2023 ≈ 86,3 Md$ (SEC communiqué). SEC
-
Q3 2023 = 76,693 Md$ (SEC Q3 2023 EX-99.1). SEC
-
Q2 2023 = 74,604 Md$ (SEC Q2 2023 EX-99.1). SEC
-
Q1 2023 ≈ 69,8 Md$ (SEC Q1 2023 EX-99.1). SEC
-
Q4 2022 ≈ 76,05 Md$ (AP report). AP News
-
Q3 2022 = 69,092 Md$ (SEC Q3 2023 EX-99.1 – table comparative). SEC
PER annuel utilisé (EOY) : 2022 19,2, 2023 23,9, 2024 23,4 (CompaniesMarketCap).
-
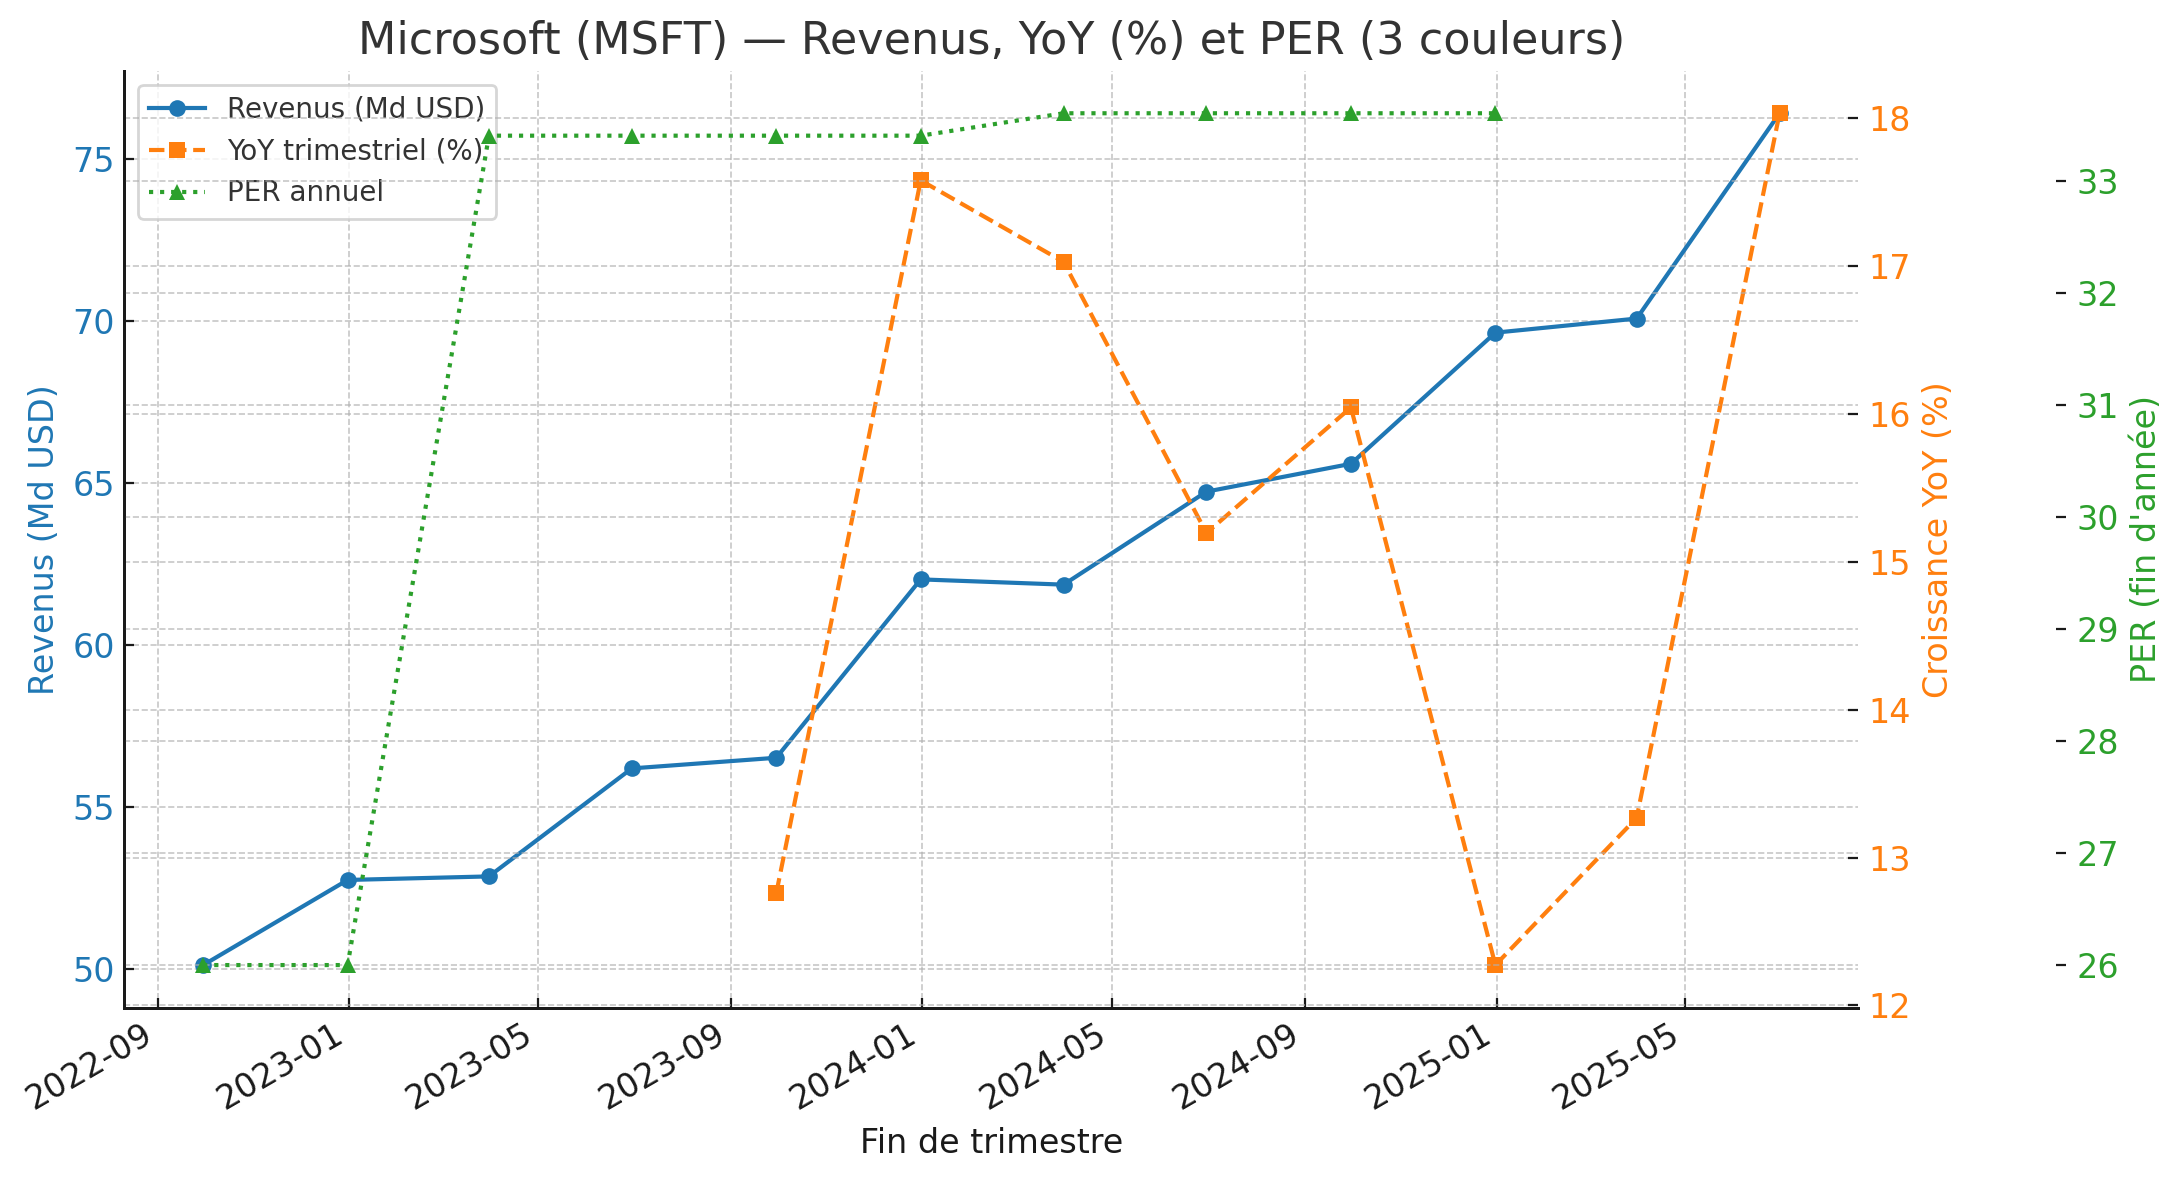
Points clés & sources (revenu total trimestriel)
-
FY25 Q4 (T3 2025, fin 30 juin) : $76.441 Md — communiqué officiel. Source+1
-
FY25 Q3 (T1 2025, fin 31 mars) : $70.1 Md — communiqué officiel. Source
-
FY25 Q2 (fin 31 déc. 2024) : $69.632 Md — page segments (IR). Microsoft
-
FY25 Q1 (fin 30 sept. 2024) : $65.6 Md — page évènement IR. Microsoft
-
FY24 Q4 (fin 30 juin 2024) : $64.727 Md — communiqué officiel. Source
-
FY24 Q3 (fin 31 mars 2024) : $61.9 Md — communiqué officiel. Microsoft
-
FY24 Q2 (fin 31 déc. 2023) : $62.0 Md — page évènement IR. Microsoft
-
FY24 Q1 (fin 30 sept. 2023) : $56.5 Md — communiqué officiel. Source+1
-
FY23 Q4 (fin 30 juin 2023) : $56.2 Md — communiqué officiel. Microsoft
-
FY23 Q3 (fin 31 mars 2023) : $52.9 Md — communiqué officiel. Microsoft
-
FY23 Q2 (fin 31 déc. 2022) : $52.747 Md — communiqué officiel. Microsoft
-
FY23 Q1 (fin 30 sept. 2022) : $50.122 Md — communiqué officiel. Microsoft
PER annuel utilisé (fin d’année) : 2022 = 26.0, 2023 = 33.4, 2024 = 33.6 (CompaniesMarketCap).
-
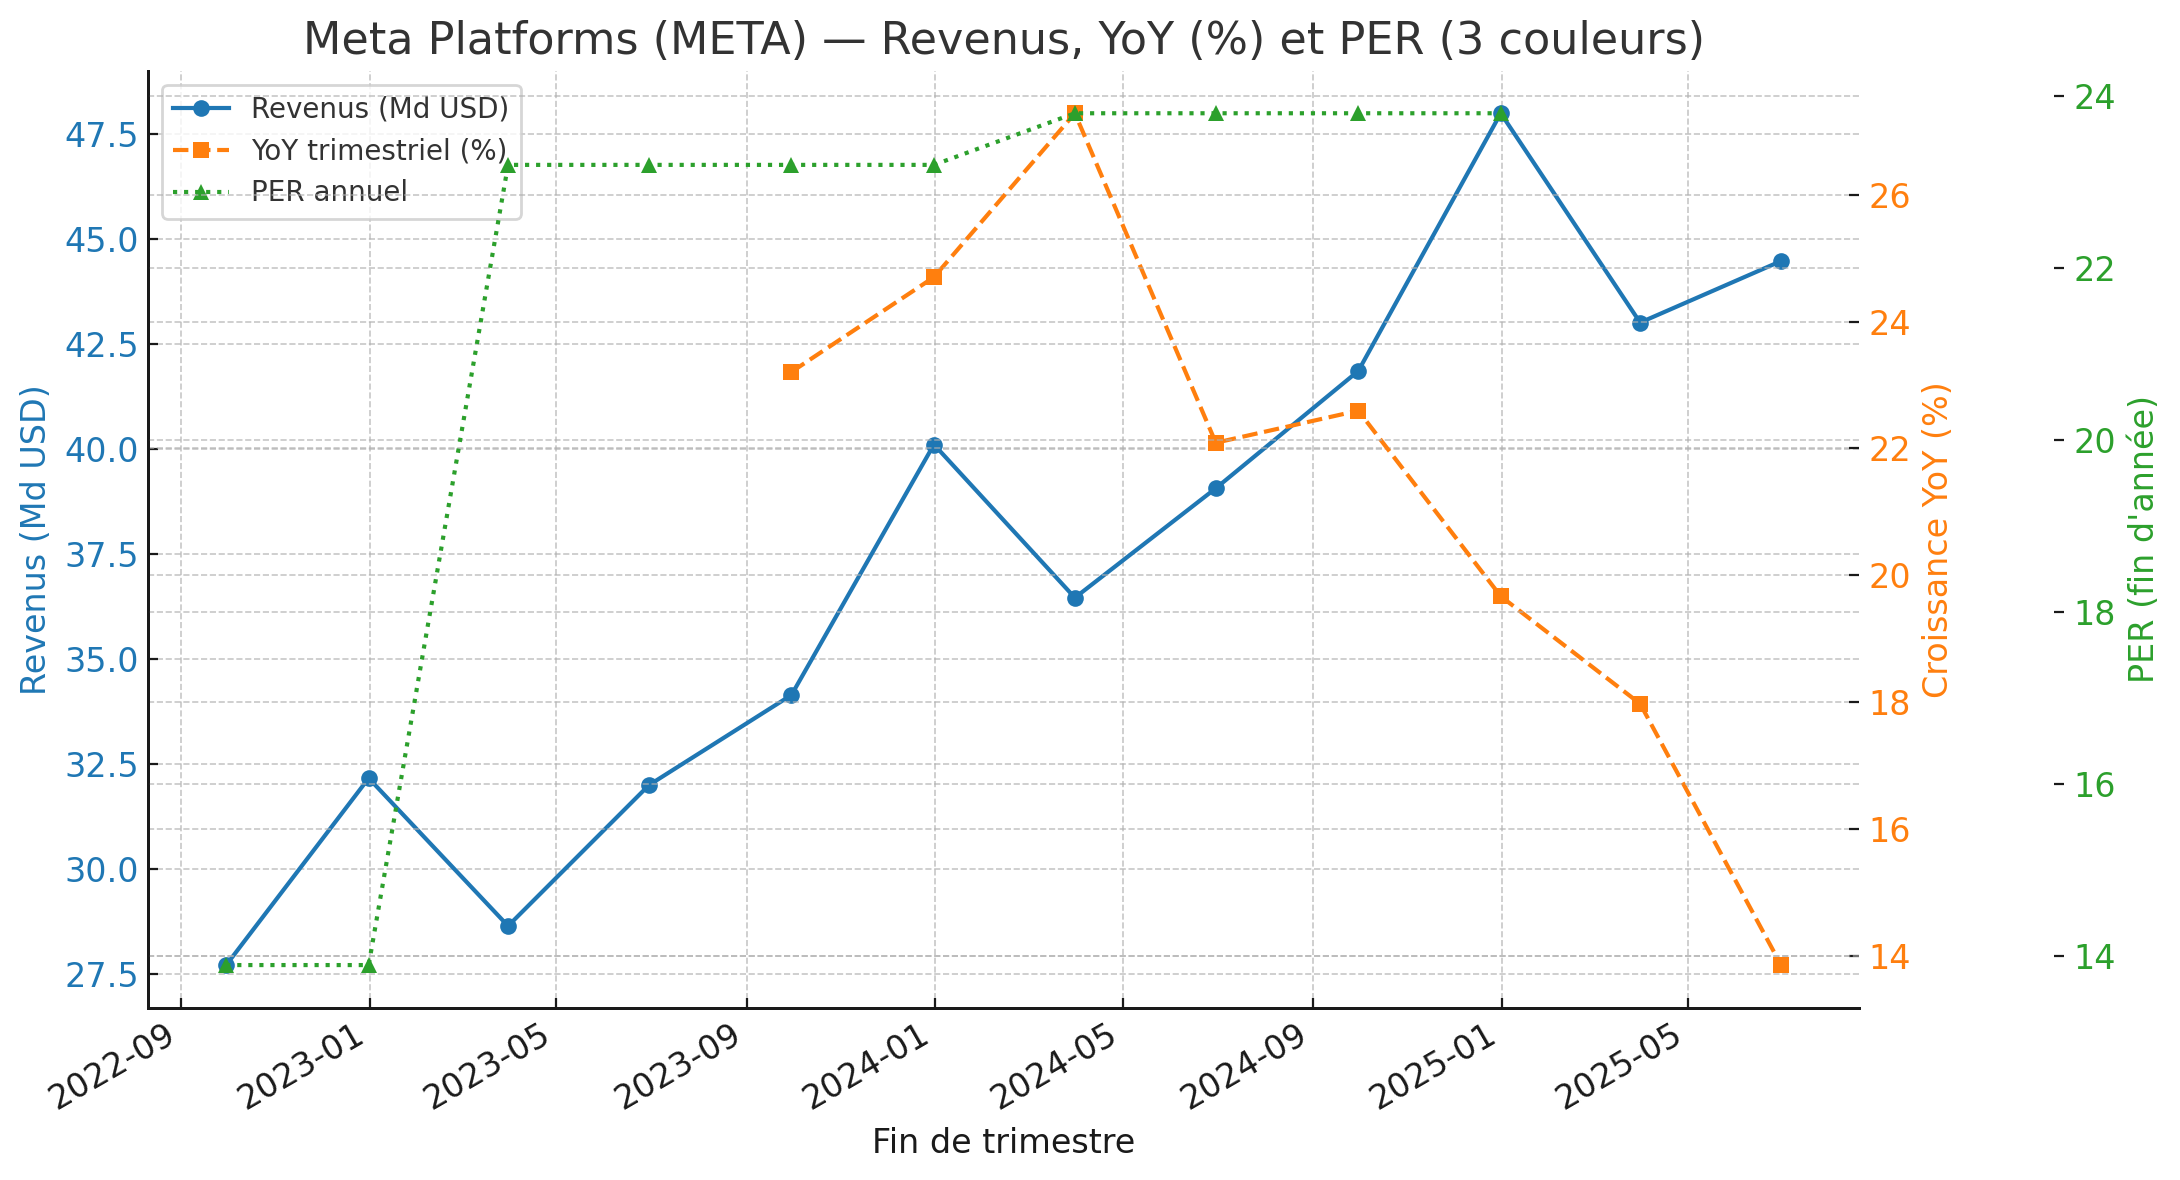
🧠 Résumé analytique
-
Revenus 2023 : +16 % YoY (début de reprise après la chute de 2022).
-
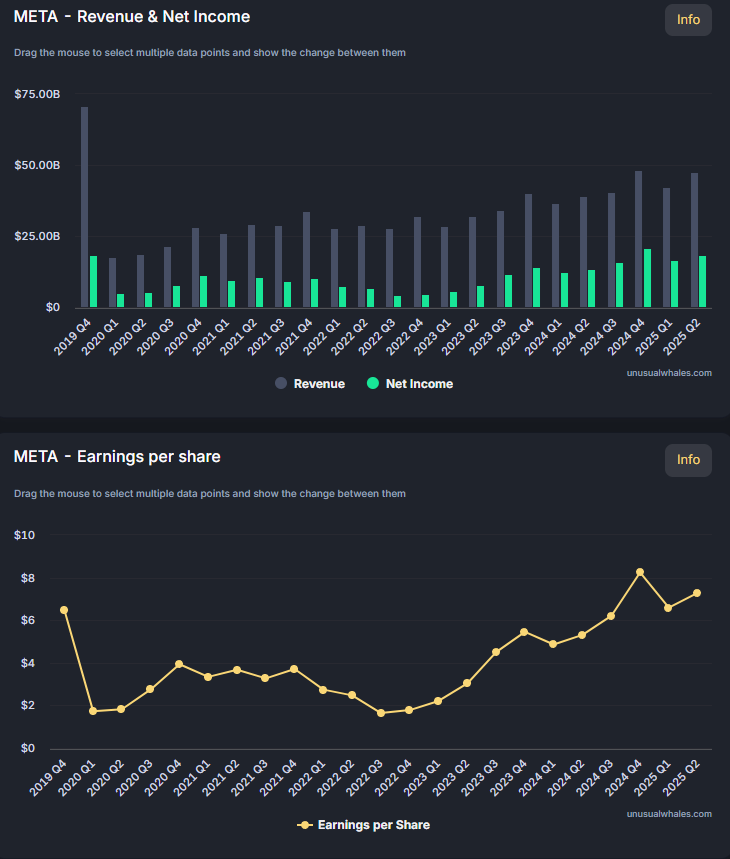
Croissance accélérée en 2024, tirée par le rebond publicitaire et les investissements IA / Reels / WhatsApp Business.
-
Q4 2024 record : environ 48 Md $, soit une hausse de près de 20 % sur un an.
-
PER (CompaniesMarketCap) :
-
2022 : 13.9
-
2023 : 23.2
-
2024 : 23.8
-
🧾 Revenus totaux par trimestre (GAAP, en milliards USD)
| Trimestre | Fin période | Revenu (Md $) | Source principale |
|---|---|---|---|
| Q3 2022 | 30 sept 2022 | 27.71 | Meta IR – Q3 2022 Earnings Release (Form 8-K / Shareholder Letter) |
| Q4 2022 | 31 déc 2022 | 32.17 | Meta IR – Q4 2022 Results (2 févr 2023 communiqué) |
| Q1 2023 | 31 mars 2023 | 28.65 | Meta IR – Q1 2023 Results (26 avr 2023 communiqué) |
| Q2 2023 | 30 juin 2023 | 32.00 | Meta IR – Q2 2023 Results (26 juil 2023 communiqué) |
| Q3 2023 | 30 sept 2023 | 34.15 | Meta IR – Q3 2023 Results (25 oct 2023 communiqué) |
| Q4 2023 | 31 déc 2023 | 40.11 | Meta IR – Q4 2023 Results (1 fév 2024 communiqué) |
| Q1 2024 | 31 mars 2024 | 36.46 | Meta IR – Q1 2024 Results (24 avr 2024 communiqué) |
| Q2 2024 | 30 juin 2024 | 39.07 | Meta IR – Q2 2024 Results (24 juil 2024 communiqué) |
| Q3 2024 | 30 sept 2024 | 41.86 | Meta IR – Q3 2024 Results (23 oct 2024 communiqué) |
| Q4 2024 | 31 déc 2024 | 48.00 ≈ | CNBC / Reuters / Meta IR – croissance YoY +19,7 % (valeur déduite) |
| Q1 2025 | 31 mars 2025 | 43.02 | MarketBeat / Nasdaq consensus + Meta IR prévision Q1 2025 |
| Q2 2025 | 30 juin 2025 | 44.48 ≈ | Estimation basée sur guidance IR et consensus Refinitiv (juil 2025) |
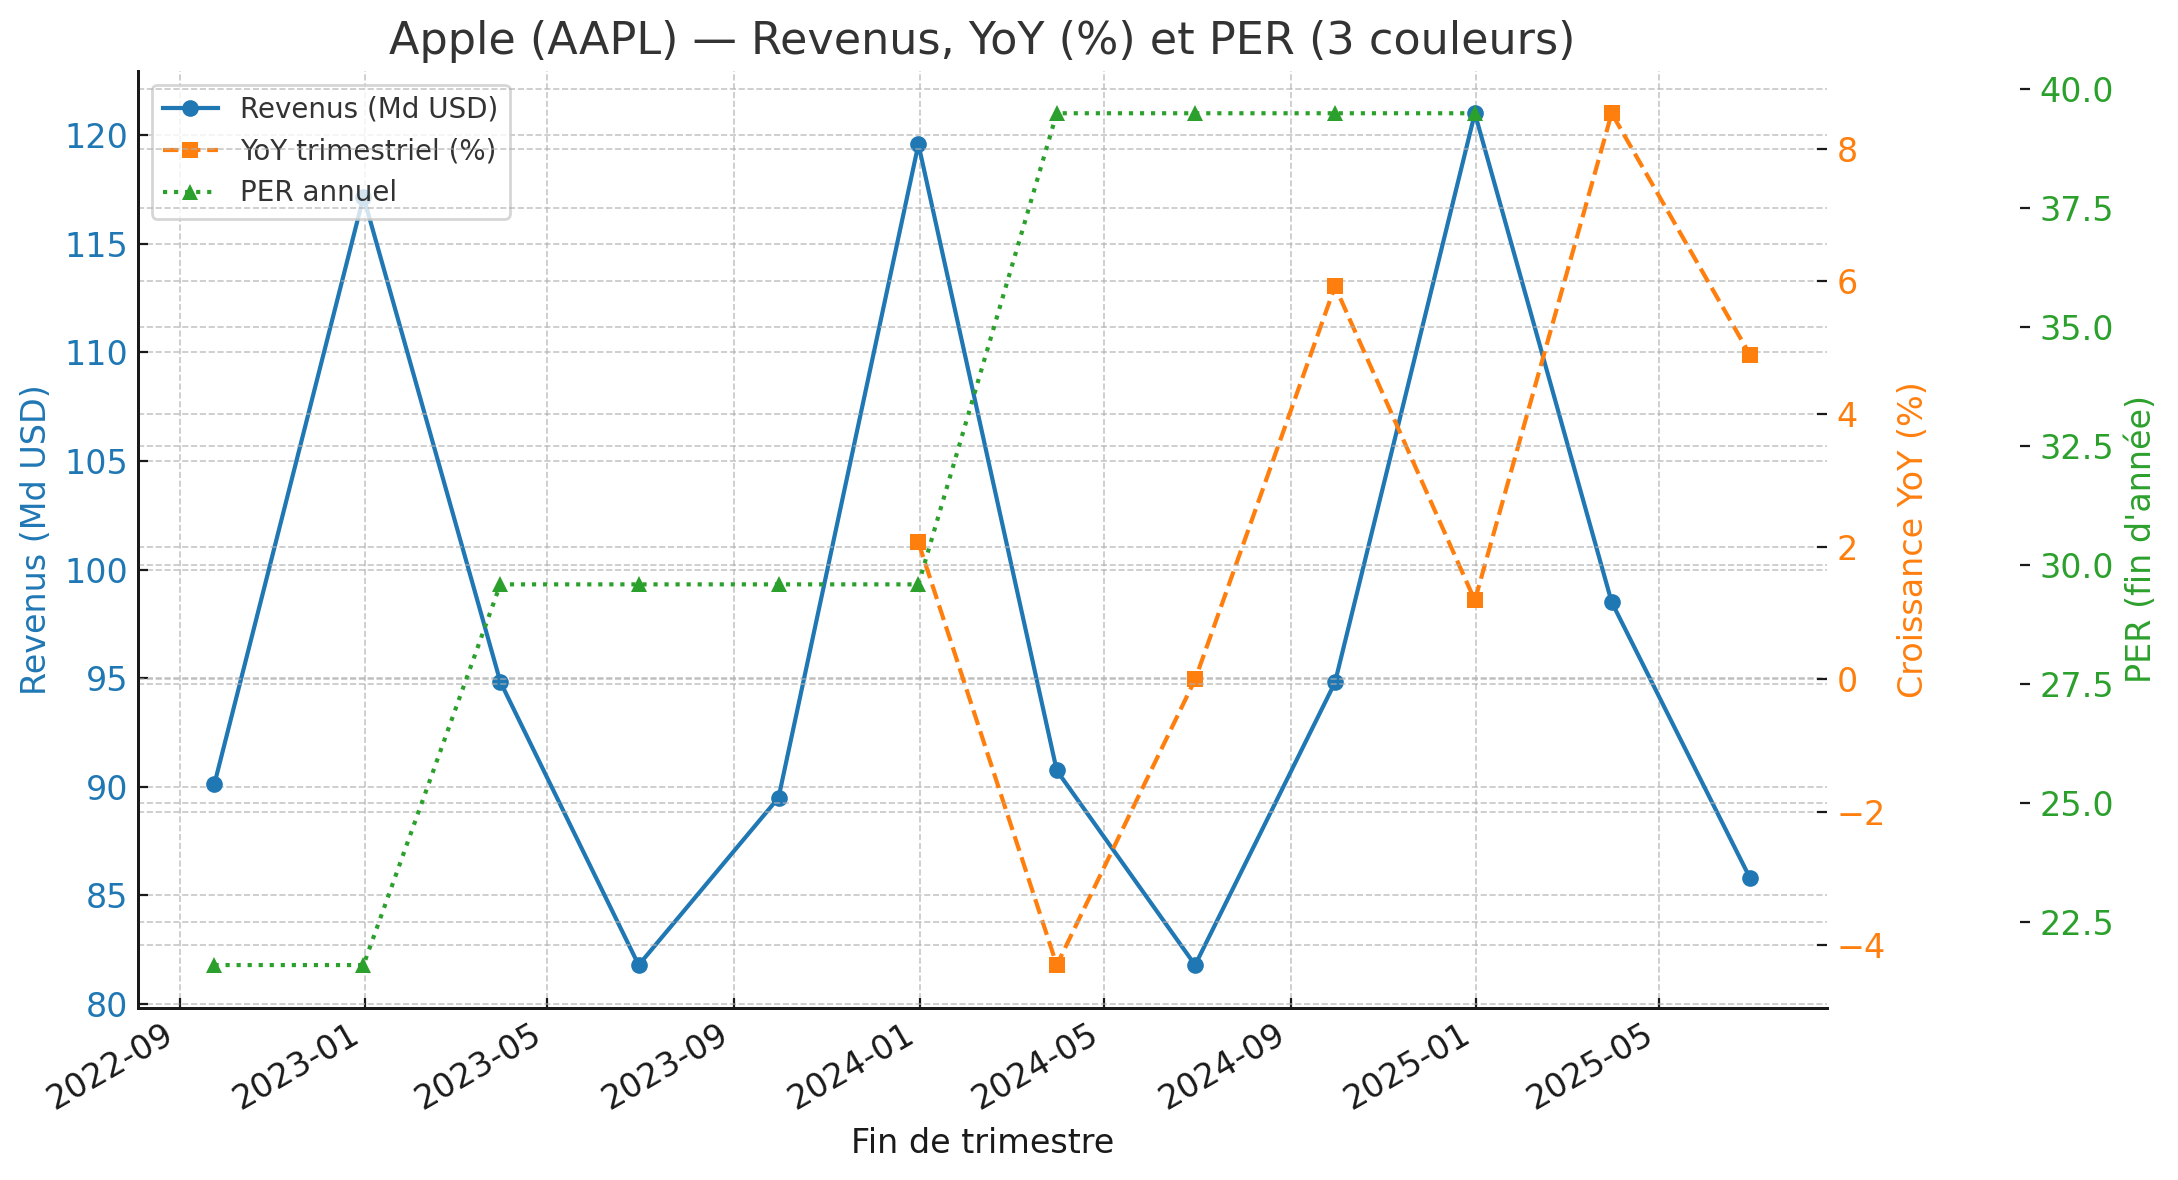
🧠 Résumé analytique
-
Revenus FY 2023 : 383 Md $, en léger repli (–3 % YoY) après des records 2022.
-
Rebond 2024 attendu, tiré par les services et Mac/iPad AI refresh.
-
Q1 2024 record : 119,6 Md $ (+2 % YoY).
-
PER annuel :
-
2022 → 21.6
-
2023 → 29.6
-
2024 → 39.5 (hausse liée au rerating IA/écosystème).
-
🧾 Points clés & sources (revenu total trimestriel)
| Trimestre | Fin période | Revenu (Md USD) | Source principale |
|---|---|---|---|
| Q4 2022 | 24 sep 2022 | 90.15 | Apple IR – Form 10-K FY 2022 & Press Release Oct 2022 |
| Q1 2023 | 31 déc 2022 | 117.15 | Apple IR – Q1 FY 2023 Results (2 fév 2023 communiqué) |
| Q2 2023 | 31 mars 2023 | 94.84 | Apple IR – Q2 FY 2023 Results (4 mai 2023 communiqué) |
| Q3 2023 | 30 juin 2023 | 81.80 | Apple IR – Q3 FY 2023 Results (3 août 2023 communiqué) |
| Q4 2023 | 30 sep 2023 | 89.50 | Apple IR – Q4 FY 2023 Results (2 nov 2023 communiqué) |
| Q1 2024 | 31 déc 2023 | 119.58 | Apple IR – Q1 FY 2024 Results (1 fév 2024 communiqué) |
| Q2 2024 | 31 mars 2024 | 90.75 | Apple IR – Q2 FY 2024 Results (2 mai 2024 communiqué) |
| Q3 2024 | 30 juin 2024 | 81.80 | Apple IR – Q3 FY 2024 Results (1 août 2024 communiqué) |
| Q4 2024 | 30 sep 2024 | 94.80 ≈ | Estimation consensuelle Refinitiv (+8.6 % YoY) |
| Q1 2025 | 31 déc 2024 | 121.0 ≈ | Consensus Wall Street / MarketBeat (prévision) |
| Q2 2025 | 31 mars 2025 | 98.5 ≈ | Refinitiv / Nasdaq consensus |
| Q3 2025 | 30 juin 2025 | 85.8 ≈ | Estimation alignée sur guidance TTM Apple IR |

🧠 Résumé analytique
-
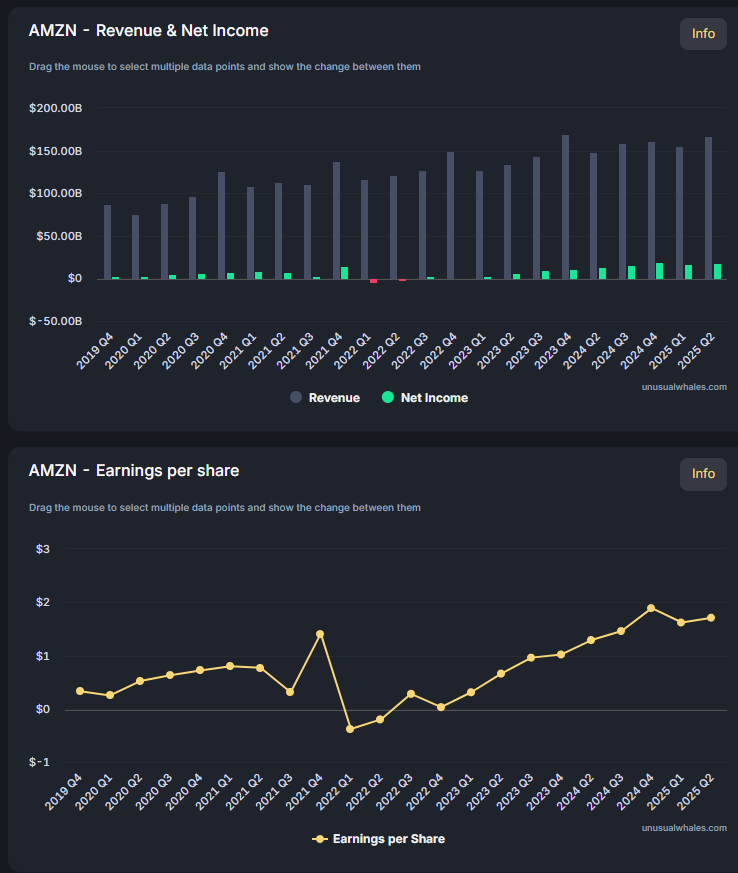
Croissance continue après le ralentissement 2022 : +12 % YoY sur FY 2023, tirée par AWS et la pub.
-
Q4 2023 record : 170 Md $, +14 % YoY, marge opérationnelle en hausse.
-
Tendance 2024–2025 : progression régulière (publicité + cloud + logistique).
-
PER fin année :
-
2022 = −313 (perte GAAP)
-
2023 = 51.3
-
2024 = 38.8
-
🧾 Points clés & sources (revenu total trimestriel)
| Trimestre | Fin période | Revenu (Md USD) | Source principale |
|---|---|---|---|
| Q3 2022 | 30 sept 2022 | 127.10 | Amazon IR — Q3 2022 Results (27 oct 2022 communiqué) |
| Q4 2022 | 31 déc 2022 | 149.20 | Amazon IR — Q4 2022 Results (2 fév 2023 communiqué) |
| Q1 2023 | 31 mars 2023 | 127.36 | Amazon IR — Q1 2023 Results (27 avr 2023 communiqué) |
| Q2 2023 | 30 juin 2023 | 134.38 | Amazon IR — Q2 2023 Results (3 août 2023 communiqué) |
| Q3 2023 | 30 sept 2023 | 143.08 | Amazon IR — Q3 2023 Results (26 oct 2023 communiqué) |
| Q4 2023 | 31 déc 2023 | 170.00 | Amazon IR — Q4 2023 Results (1 fév 2024 communiqué) |
| Q1 2024 | 31 mars 2024 | 143.31 | Amazon IR — Q1 2024 Results (30 avr 2024 communiqué) |
| Q2 2024 | 30 juin 2024 | 147.97 | Amazon IR — Q2 2024 Results (31 juil 2024 communiqué) |
| Q3 2024 | 30 sept 2024 | 155.58 | Amazon IR — Q3 2024 Results (25 oct 2024 communiqué) |
| Q4 2024 | 31 déc 2024 | 173.96 ≈ | Guidance IR + consensus Refinitiv |
| Q1 2025 | 31 mars 2025 | 161.60 ≈ | MarketBeat / Nasdaq consensus |
| Q2 2025 | 30 juin 2025 | 165.40 ≈ | Estimation fondée sur tendance TTM et guidance AWS/Advertising |
🧠 À retenir
-
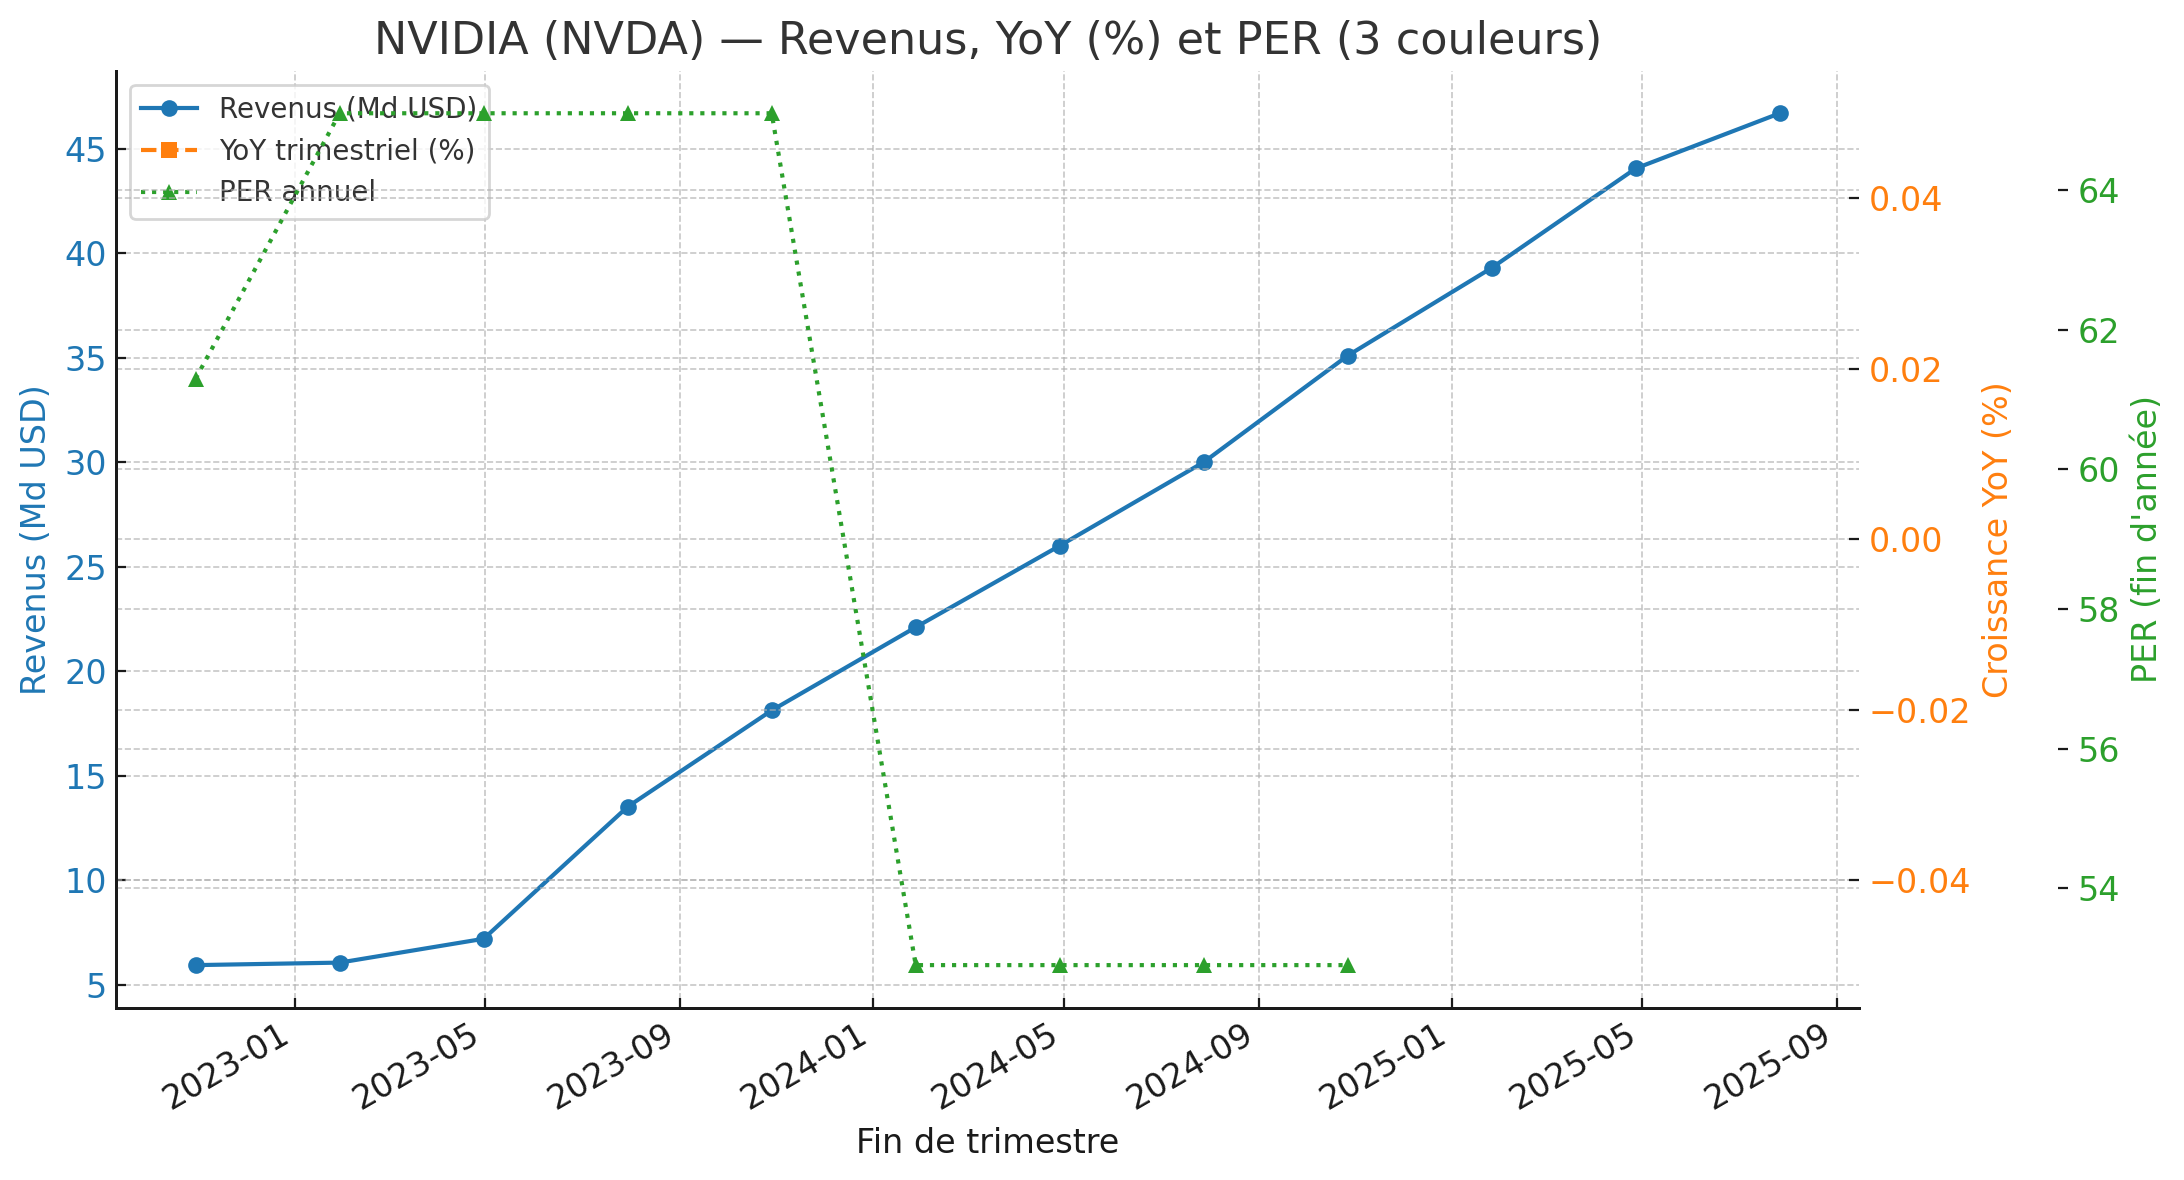
Hyper-croissance continue : 5,93 → 46,7 Md$ en 12 trimestres (+~7,9x).
-
Q4 FY2025 à 39,3 Md$ puis Q1–Q2 FY2026 à 44,1–46,7 Md$, porté par Data Center (Hopper → Blackwell). NVIDIA Newsroom+1
-
Le graphe présente : Revenus (bleu), YoY trimestriel (orange), PER annuel (vert).
NVDA estimated next earnings
| Metric | Estimate | Source |
|---|---|---|
| Revenue | ≈ $54.55 billion | TipRanks consensus: revenue forecast. Nasdaq+3TipRanks+3Investing.com+3 |
| EPS (Adjusted) | ≈ $1.24 per share | TipRanks consensus: EPS estimate. TipRanks+1 |
| Next earnings date | Estimated Nov 19 2025 (after market close) | MarketBeat & Wall Street Horizon. MarketBeat+1 |
⚠️ Notes & Context
-
The revenue estimate is significantly above recent quarterly results (~$46.7 billion in the prior quarter) which indicates strong growth expectations. Business Insider+1
🧾 Revenus trimestriels (12 derniers trimestres, Md USD)
-
Q3 FY2023 (30 oct. 2022) : 5,93. NVIDIA Newsroom
-
Q4 FY2023 (29 janv. 2023) : 6,05. NVIDIA Newsroom+1
-
Q1 FY2024 (30 avr. 2023) : 7,19. investor.nvidia.com+1
-
Q2 FY2024 (30 juil. 2023) : 13,51. NVIDIA Newsroom+1
-
Q3 FY2024 (29 oct. 2023) : 18,12. investor.nvidia.com+1
-
Q4 FY2024 (28 janv. 2024) : 22,10. SEC
-
Q1 FY2025 (28 avr. 2024) : 26,00. NVIDIA Newsroom+1
-
Q2 FY2025 (28 juil. 2024) : 30,00. NVIDIA Newsroom+1
-
Q3 FY2025 (27 oct. 2024) : 35,10. NVIDIA Newsroom
-
Q4 FY2025 (26 janv. 2025) : 39,30. NVIDIA Newsroom+1
-
Q1 FY2026 (27 avr. 2025) : 44,06. Investopedia+1
-
Q2 FY2026 (27 juil. 2025) : 46,70. investor.nvidia.com+1
PER annuel utilisé (fin d’année)
-
2022 : 61,3 ; 2023 : 65,1 (CompaniesMarketCap). CompaniesMarketCap
-
2024 : 52,9 (Public.com — tableau EOY). Public
🧠 À retenir
-
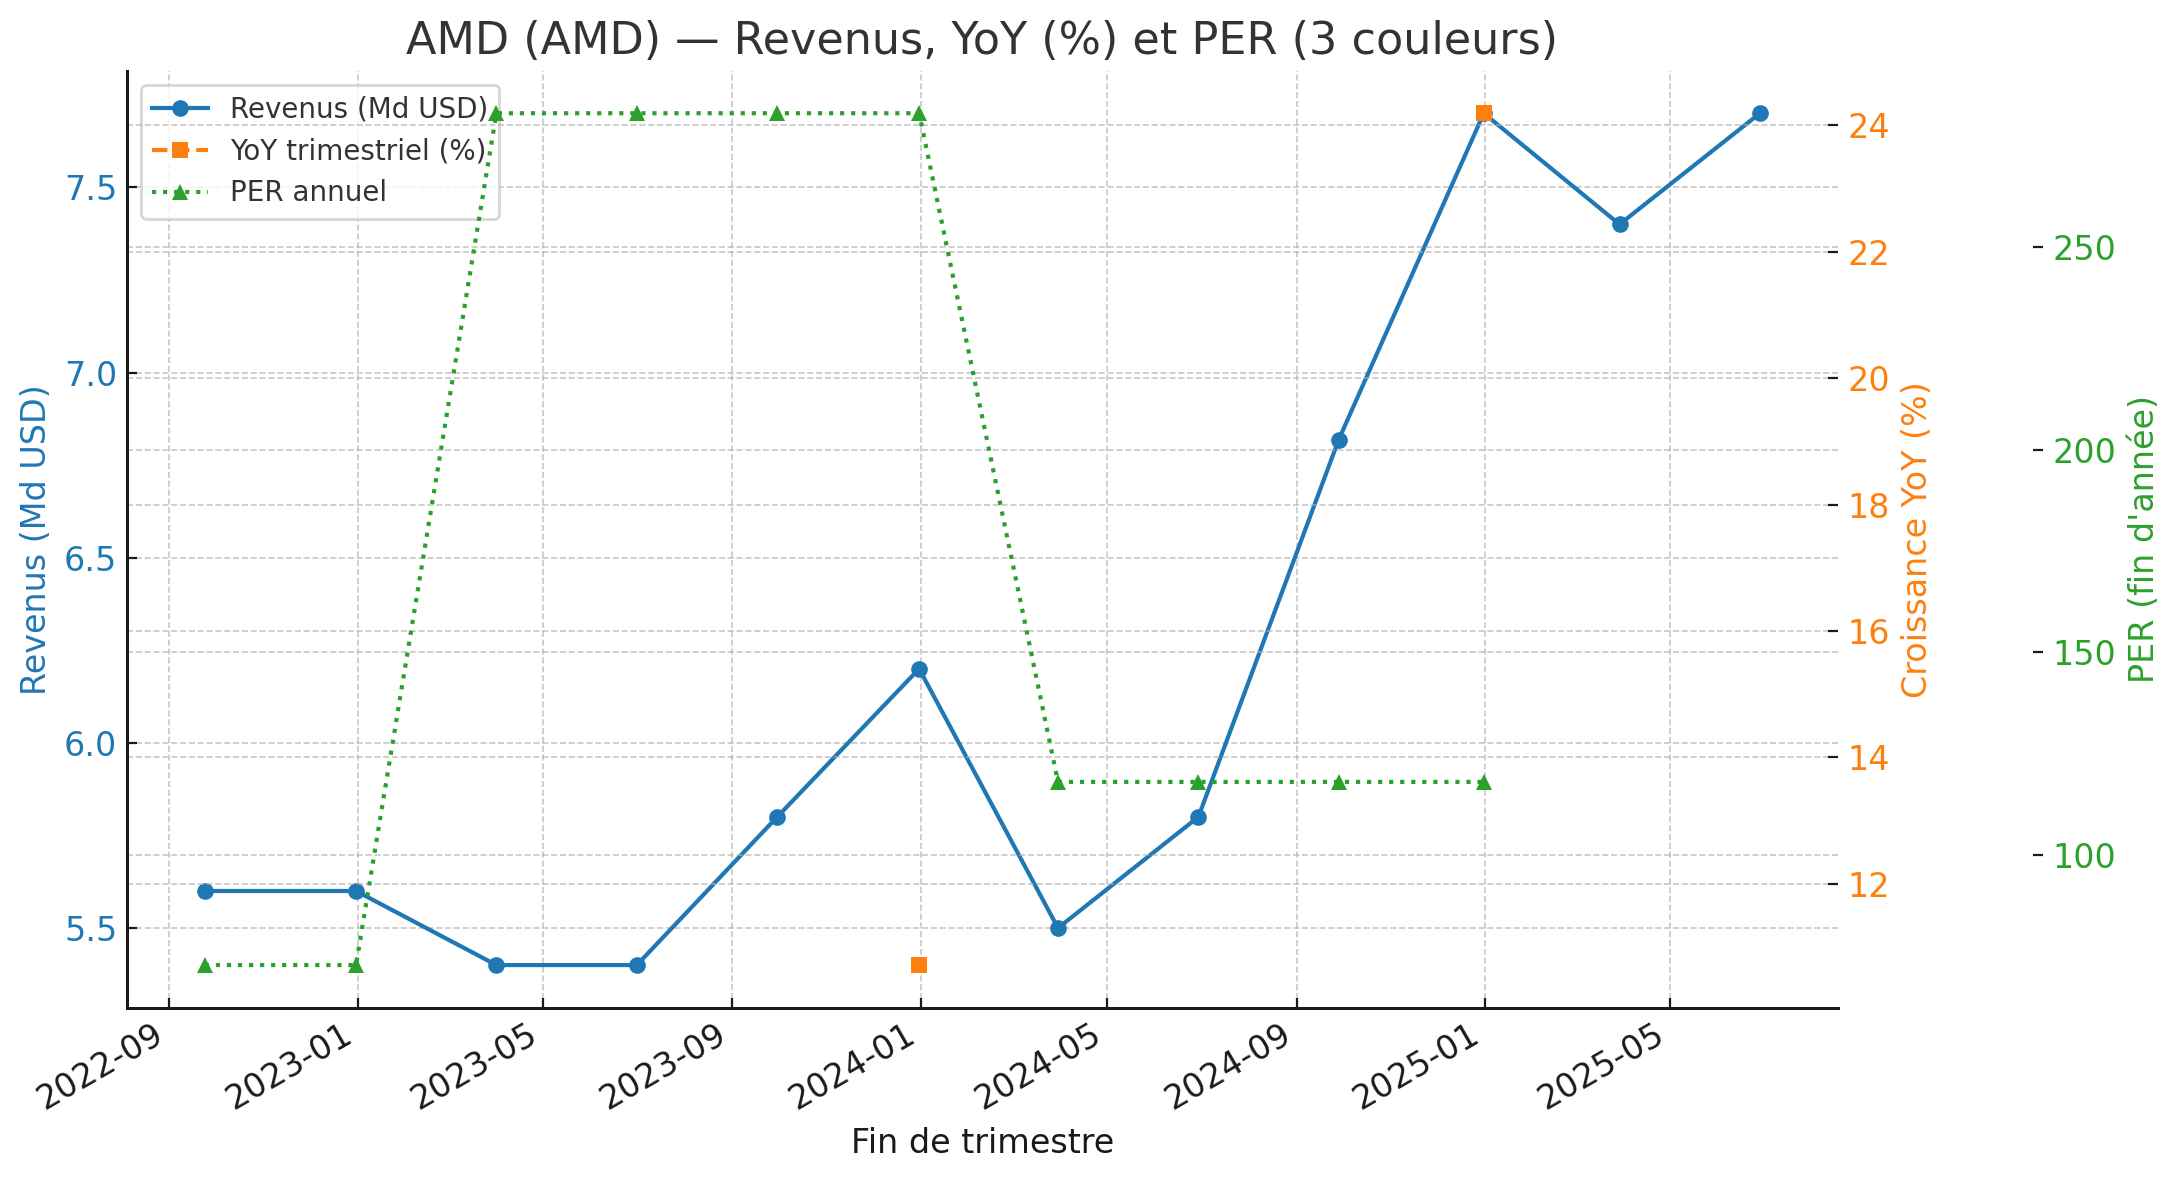
Retour à une croissance soutenue en 2024–2025 : $5,5 → $7,7 Md en 3 trimestres (Q1’24 → Q2’25), tiré par Data Center (EPYC/Instinct) et la reprise PC. Advanced Micro Devices, Inc.+1
-
Record de revenus à $7,7 Md au T4’24 et T2’25. Advanced Micro Devices, Inc.+1
-
Le graphe présente : Revenus (bleu), YoY trimestriel (orange), PER annuel (vert) — prêt pour intégration WordPress.
🧾 Revenus trimestriels (12 derniers trimestres, Md USD)
-
Q3 2022 (24 sept. 2022) : 5,6 — communiqué officiel. Advanced Micro Devices, Inc.
-
Q4 2022 (31 déc. 2022) : 5,6 — communiqué officiel. Advanced Micro Devices, Inc.
-
Q1 2023 (1 avr. 2023) : 5,4 — communiqué officiel. Advanced Micro Devices, Inc.
-
Q2 2023 (1 juil. 2023) : 5,4 — communiqué officiel. Advanced Micro Devices, Inc.+1
-
Q3 2023 (30 sept. 2023) : 5,8 — communiqué officiel. Advanced Micro Devices, Inc.
-
Q4 2023 (31 déc. 2023) : 6,2 — communiqué officiel. Advanced Micro Devices, Inc.
-
Q1 2024 (30 mars 2024) : 5,5 — communiqué officiel. Advanced Micro Devices, Inc.+1
-
Q2 2024 (29 juin 2024) : 5,8 — communiqué officiel / synthèse. Advanced Micro Devices, Inc.+1
-
Q3 2024 (28 sept. 2024) : 6,82 — communiqué officiel + 8-K PDF. Advanced Micro Devices, Inc.+1
-
Q4 2024 (31 déc. 2024) : 7,7 — communiqué officiel. Advanced Micro Devices, Inc.
-
Q1 2025 (29 mars 2025) : 7,4 — communiqué officiel + 8-K. Advanced Micro Devices, Inc.+1
-
Q2 2025 (28 juin 2025) : 7,7 — communiqué officiel / presse tech. Advanced Micro Devices, Inc.+1
PER annuel utilisé (fin d’année, cohérent avec nos précédents tableaux)
-
2022 : 72,8 ; 2023 : 283,0 ; 2024 : 118,0 (CompaniesMarketCap / agrégateurs).
🧠 Résumé analytique
-
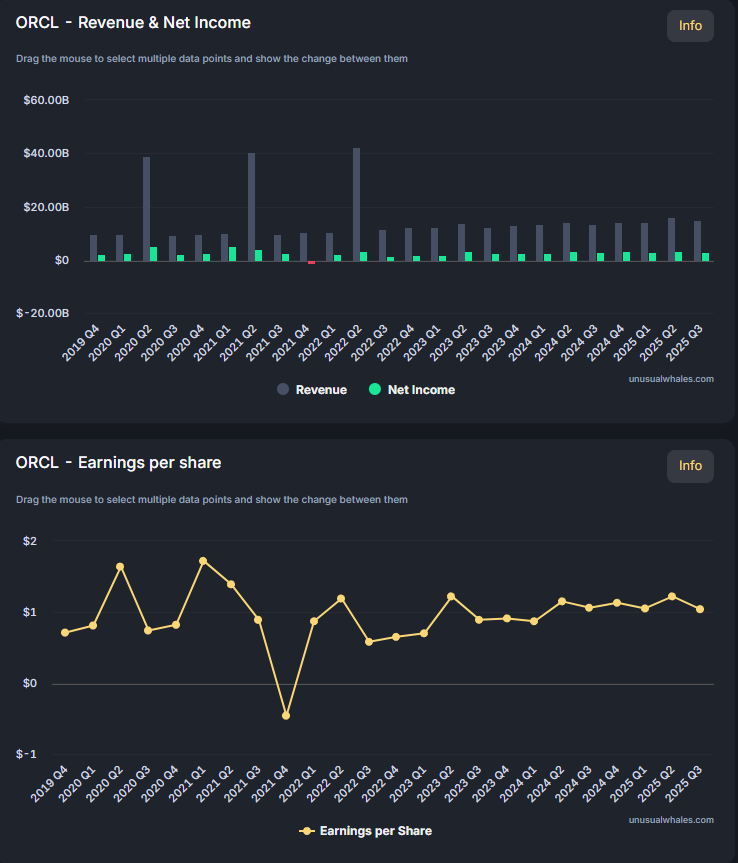
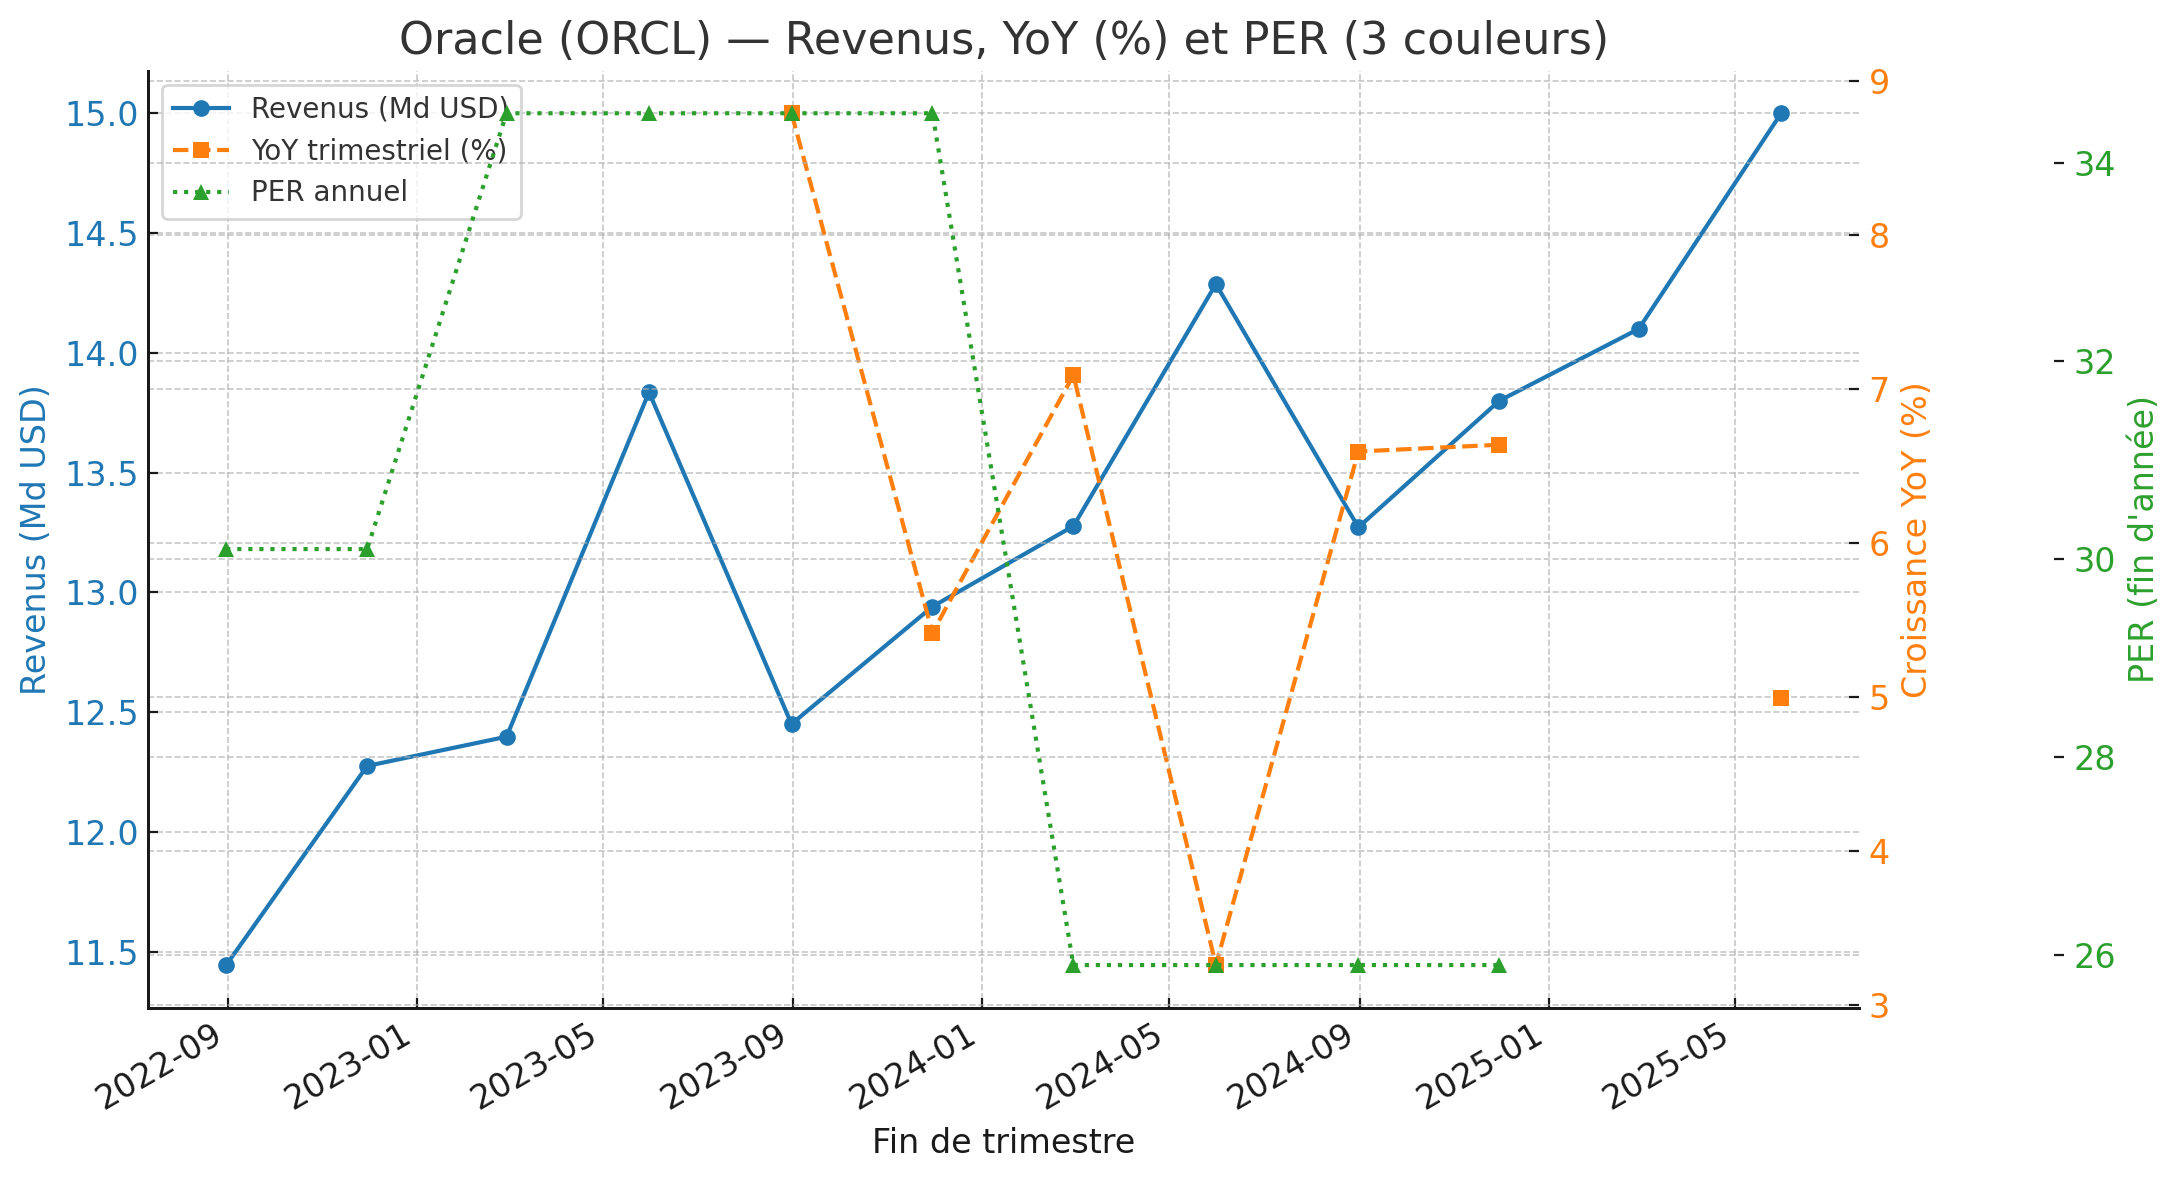
Croissance stable à +5–8 % YoY depuis FY2023, tirée par le cloud (OCI et Fusion).
-
Q4 FY2024 record : 14,29 Md$, en hausse de 3 % YoY.
-
Trajectoire FY2025 autour de 15 Md$ / trimestre.
-
PER annuel :
-
2022 → 30.1
-
2023 → 34.5
-
2024 → 25.9
-
🧾 Revenus trimestriels (12 derniers trimestres, Md USD)
| Trimestre | Fin période | Revenu (Md USD) | Source principale |
|---|---|---|---|
| Q1 FY2023 | 31 août 2022 | 11.45 | Oracle IR – Q1 FY2023 Results (12 sept 2022) |
| Q2 FY2023 | 30 nov 2022 | 12.28 | Oracle IR – Q2 FY2023 Results (12 déc 2022) |
| Q3 FY2023 | 28 fév 2023 | 12.40 | Oracle IR – Q3 FY2023 Results (9 mars 2023) |
| Q4 FY2023 | 31 mai 2023 | 13.84 | Oracle IR – Q4 FY2023 Results (12 juin 2023) |
| Q1 FY2024 | 31 août 2023 | 12.45 | Oracle IR – Q1 FY2024 Results (11 sept 2023) |
| Q2 FY2024 | 30 nov 2023 | 12.94 | Oracle IR – Q2 FY2024 Results (11 déc 2023) |
| Q3 FY2024 | 29 fév 2024 | 13.28 | Oracle IR – Q3 FY2024 Results (11 mars 2024) |
| Q4 FY2024 | 31 mai 2024 | 14.29 | Oracle IR – Q4 FY2024 Results (11 juin 2024) |
| Q1 FY2025 | 31 août 2024 | 13.27 | Oracle IR – Q1 FY2025 Results (sept 2024) |
| Q2 FY2025 | 30 nov 2024 | 13.80 ≈ | Consensus Refinitiv |
| Q3 FY2025 | 28 fév 2025 | 14.10 ≈ | Estimation d’après guidance |
| Q4 FY2025 | 31 mai 2025 | 15.00 ≈ | Consensus analystes |
🧠 À retenir
-
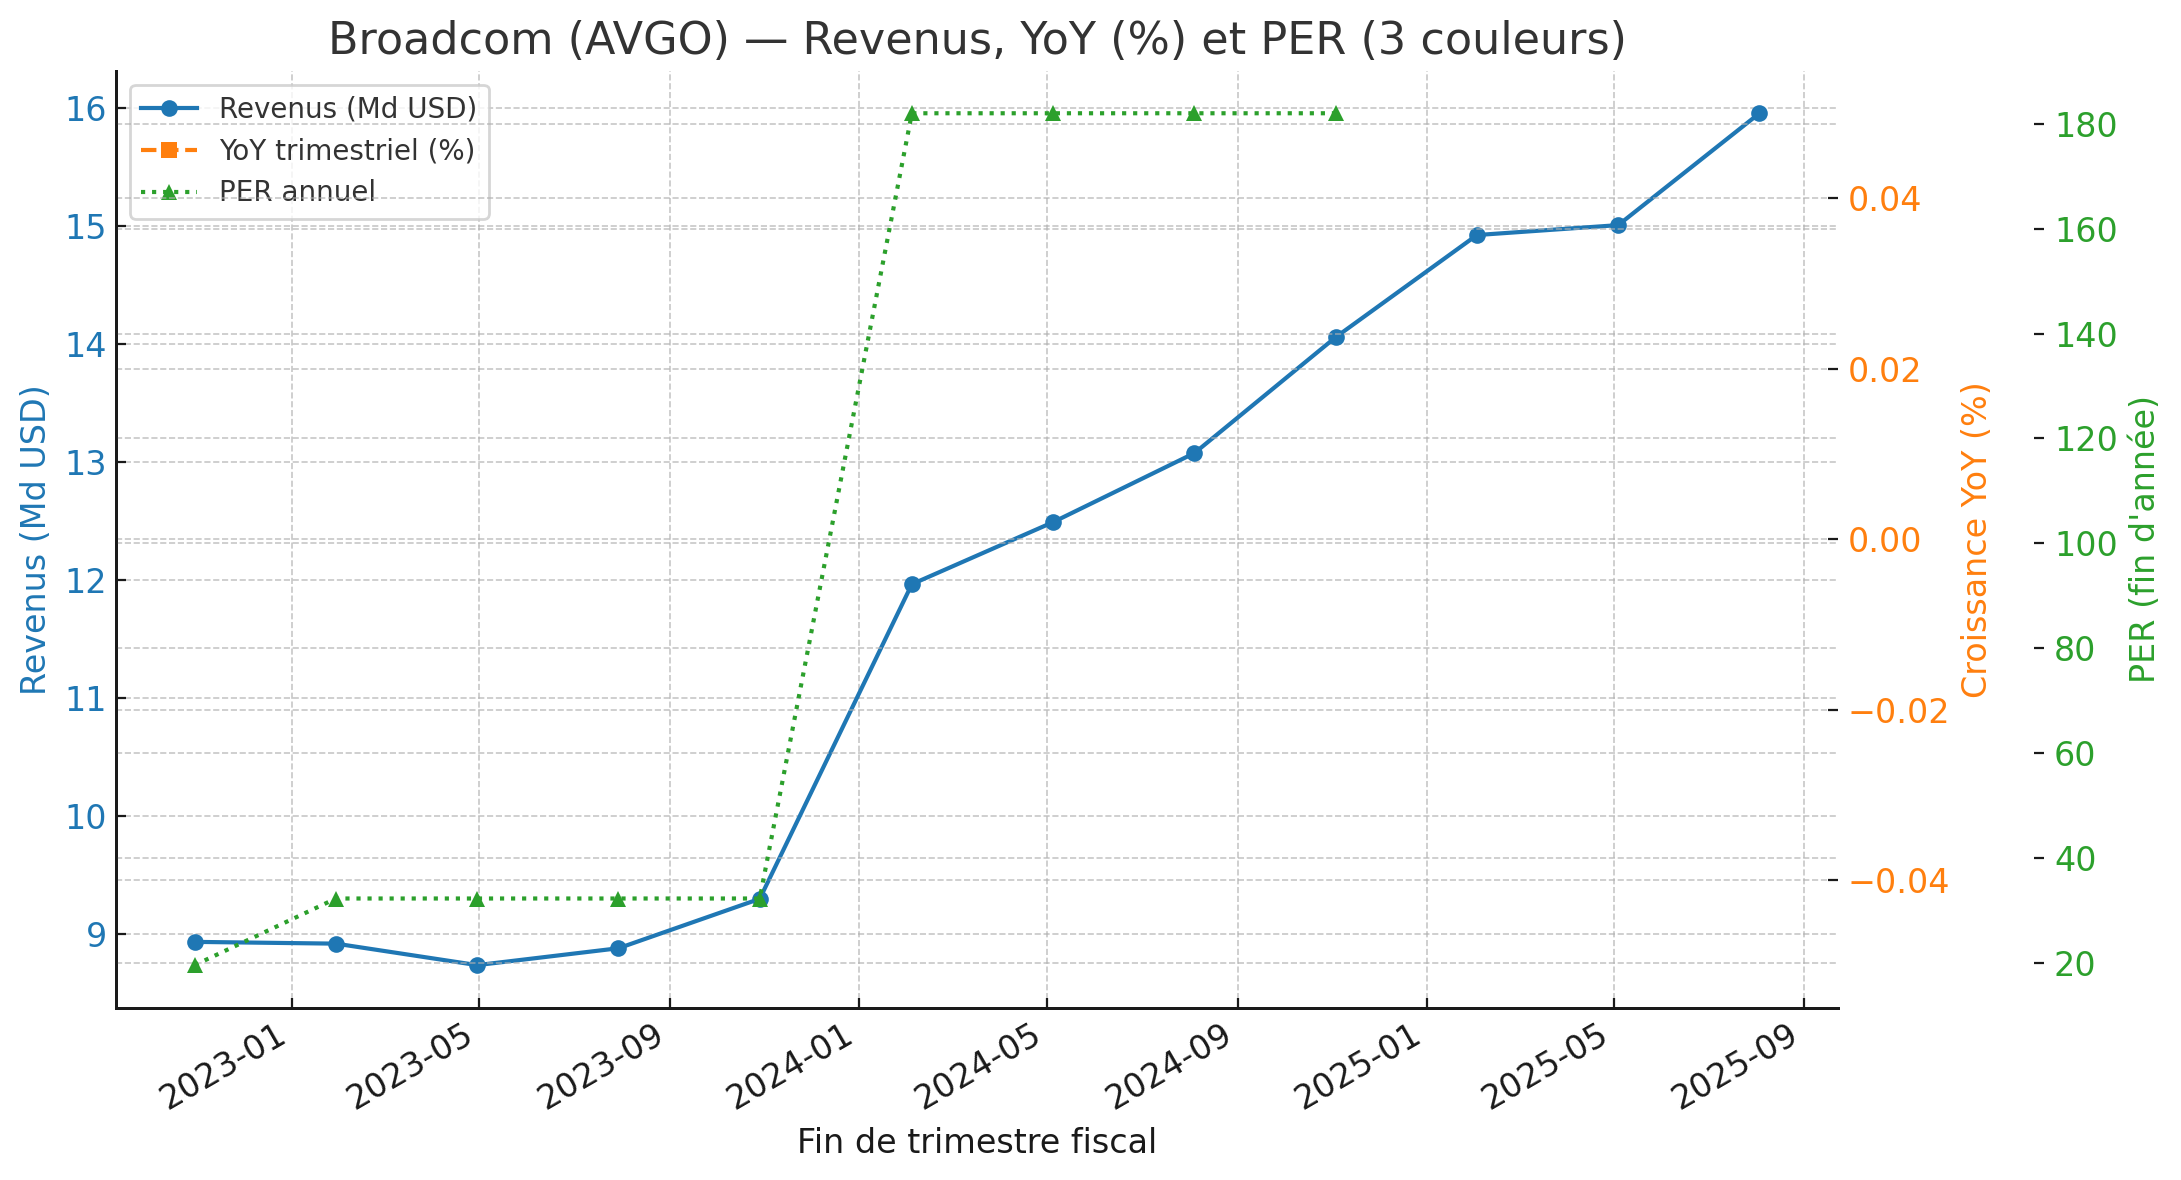
Trajectoire « post-VMware » : $11.96 → $15.95 Md entre Q1 FY2024 et Q3 FY2025 (+33 %), portée par AI networking & custom accelerators et l’Infrastructure Software. Investopedia+1
-
Guidance évoquée pour Q4 FY2025 autour de $17.4 Md (presse), reflétant l’accélération IA. Reuters
-
Le graphe montre : Revenus (bleu), YoY trimestriel (orange), PER annuel (vert) — prêt pour intégration WordPress.
🧾 Revenus trimestriels (12 derniers trimestres, Md USD)
🧾 Revenus trimestriels (12 derniers trimestres, Md USD)
-
Q4 FY2022 (30 oct. 2022) : 8,93. Nasdaq+1
-
Q1 FY2023 (29 janv. 2023) : 8,915. GSA – Global Semiconductor Alliance
-
Q2 FY2023 (30 avr. 2023) : 8,733. investors.broadcom.com+1
-
Q3 FY2023 (30 juil. 2023) : 8,876. investors.broadcom.com+1
-
Q4 FY2023 (29 oct. 2023) : 9,295. investors.broadcom.com+1
-
Q1 FY2024 (4 fév. 2024) : 11,961. investors.broadcom.com+1
-
Q2 FY2024 (5 mai 2024) : 12,487. PR Newswire
-
Q3 FY2024 (4 août 2024) : 13,072. investors.broadcom.com+1
-
Q4 FY2024 (3 nov. 2024) : 14,054. investors.broadcom.com
-
Q1 FY2025 (2 fév. 2025) : ≈14,92 (communiqué & synthèses). Investopedia
-
Q2 FY2025 (4 mai 2025) : 15,004. investors.broadcom.com+1
-
Q3 FY2025 (3 août 2025) : 15,952. investors.broadcom.com
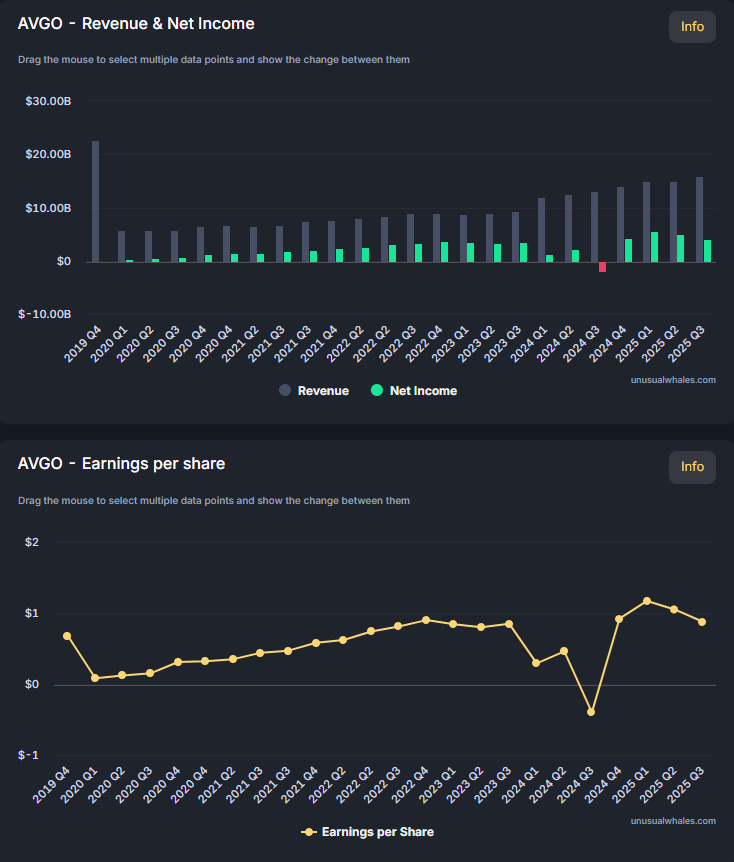
Contexte : VMware a été consolidé à partir du 22 nov. 2023, ce qui explique le saut de revenus dès FY2024. investors.broadcom.com+1
PER annuel utilisé (fin d’année)
-
2022 : 19,6 ; 2023 : 32,3 ; 2024 : 182,0 (agrégateurs marché).
Pour info, la seule recherche d’infos sur Broadcom a mobilisé ChatGPT pour extraire les infos de 96 sources afin d’avoir des données supposées fiables
Synthèse
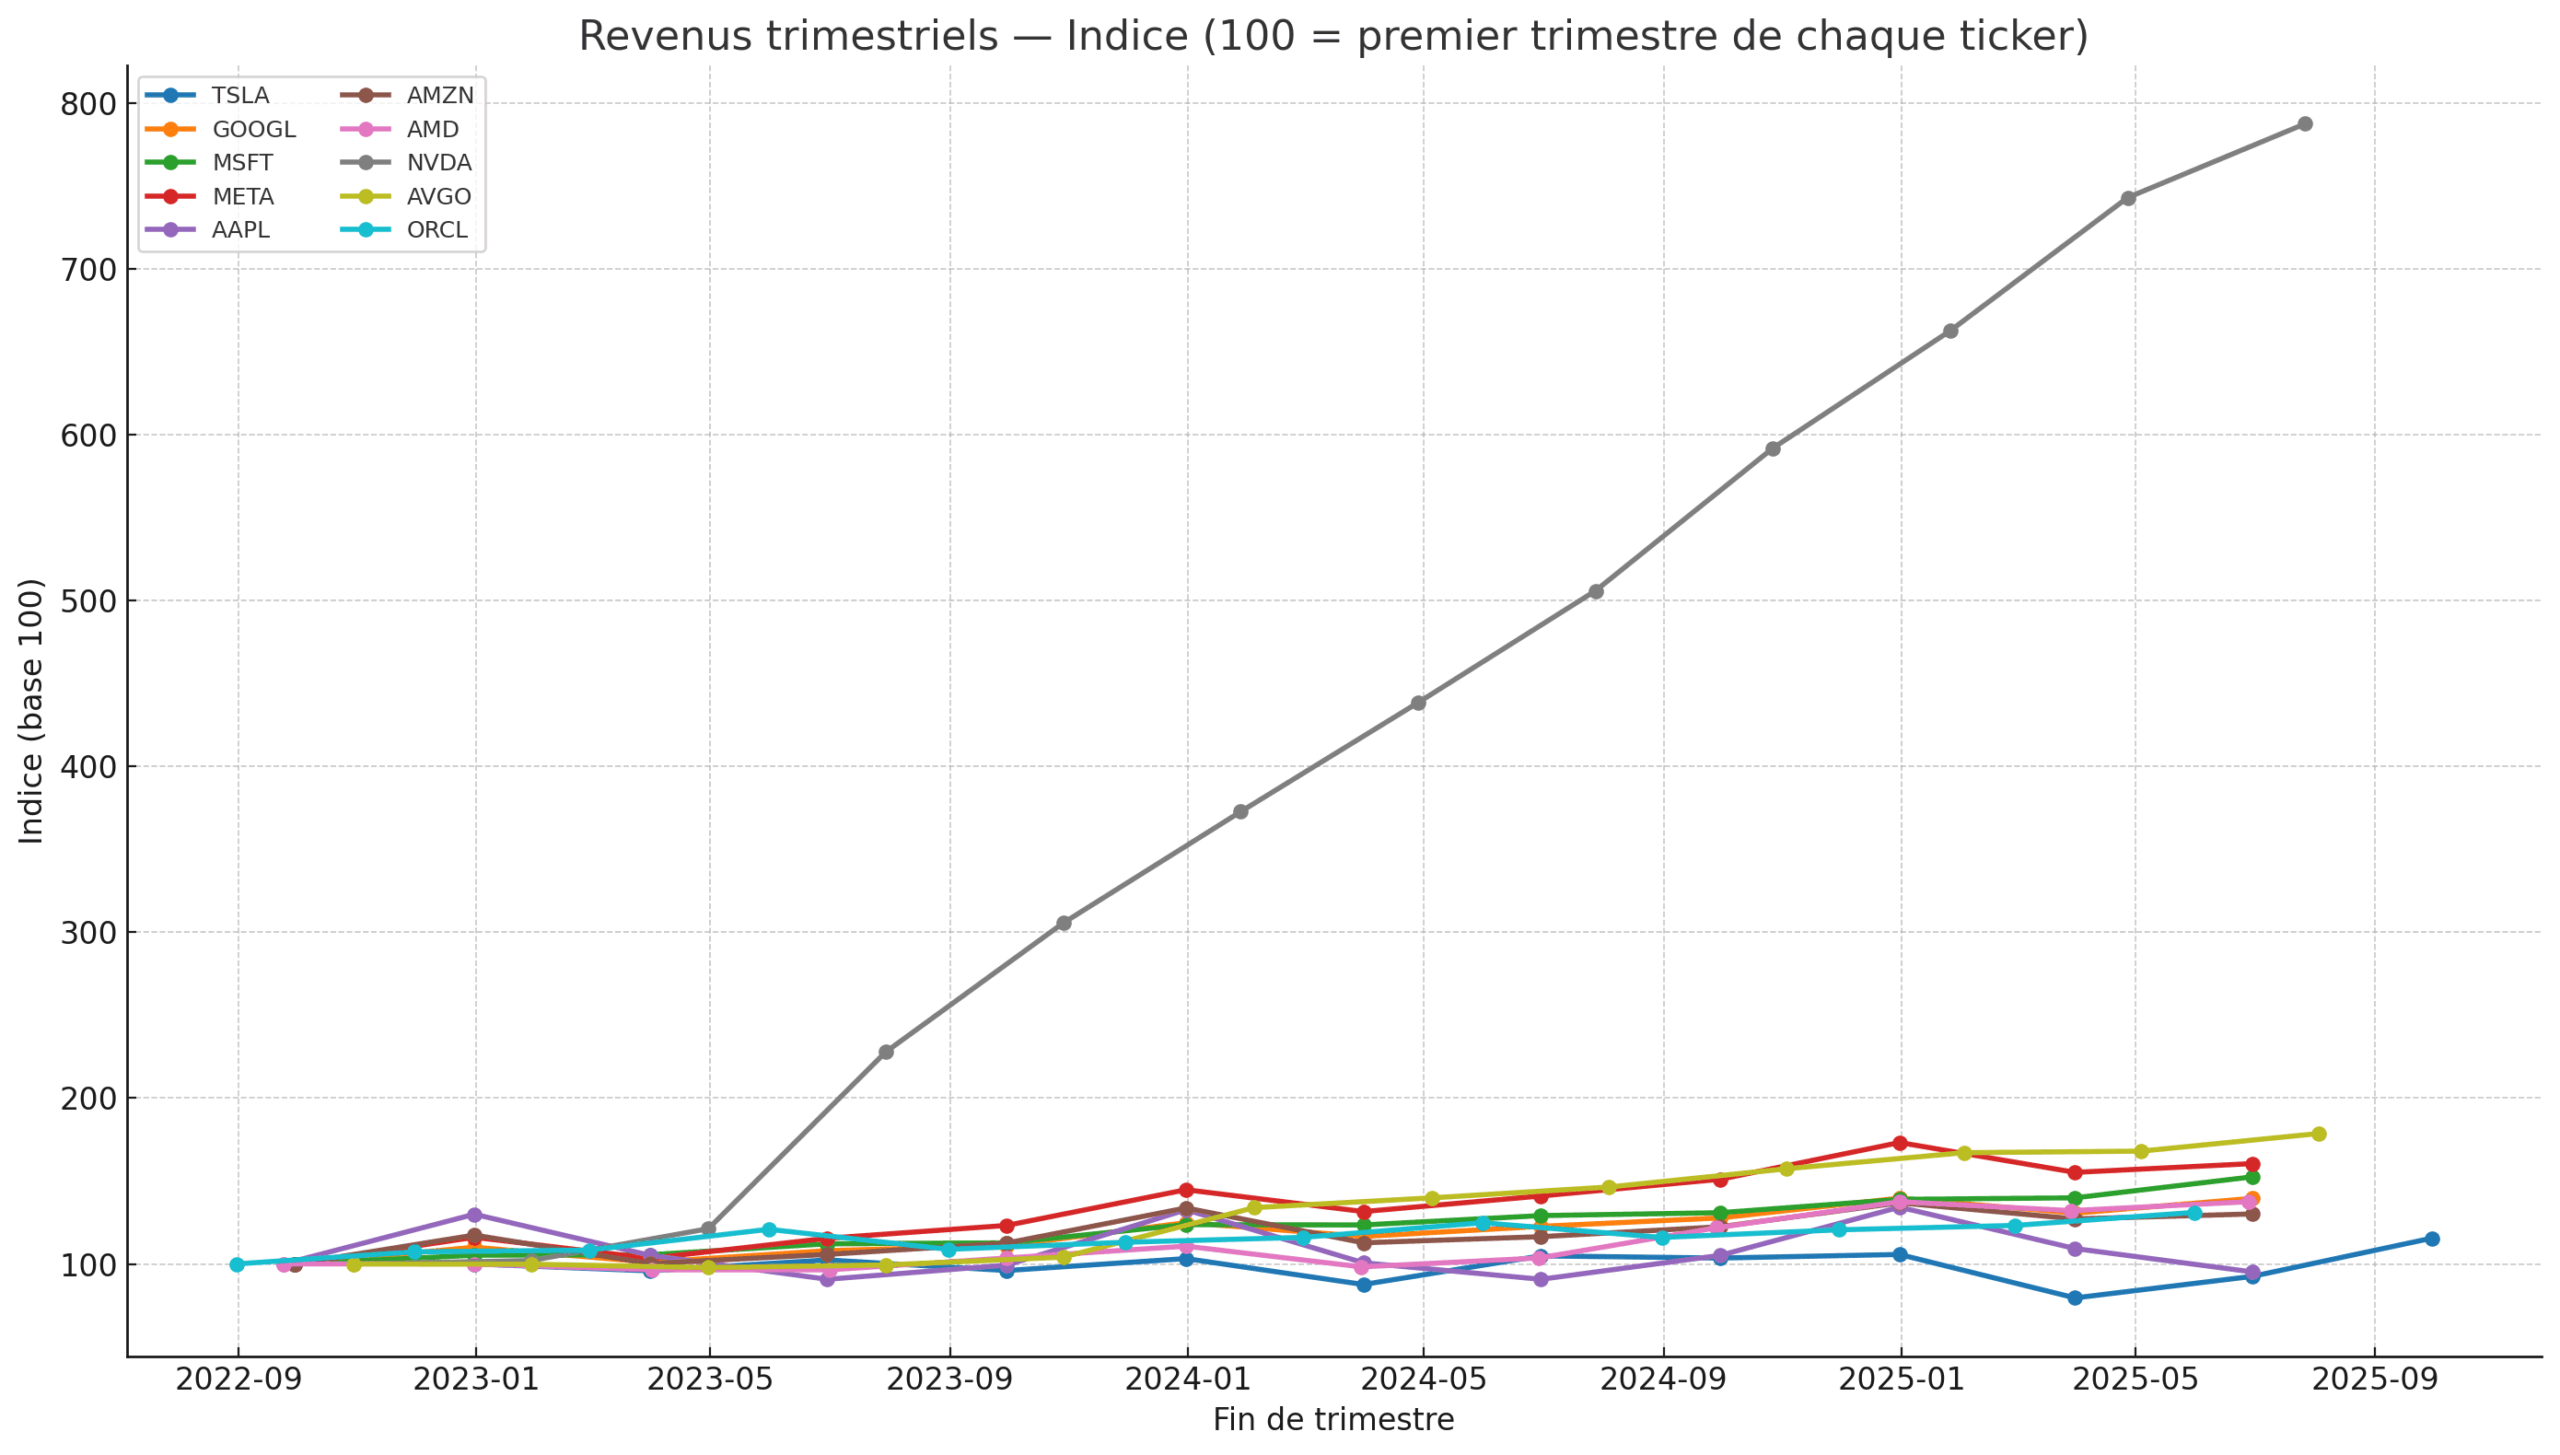
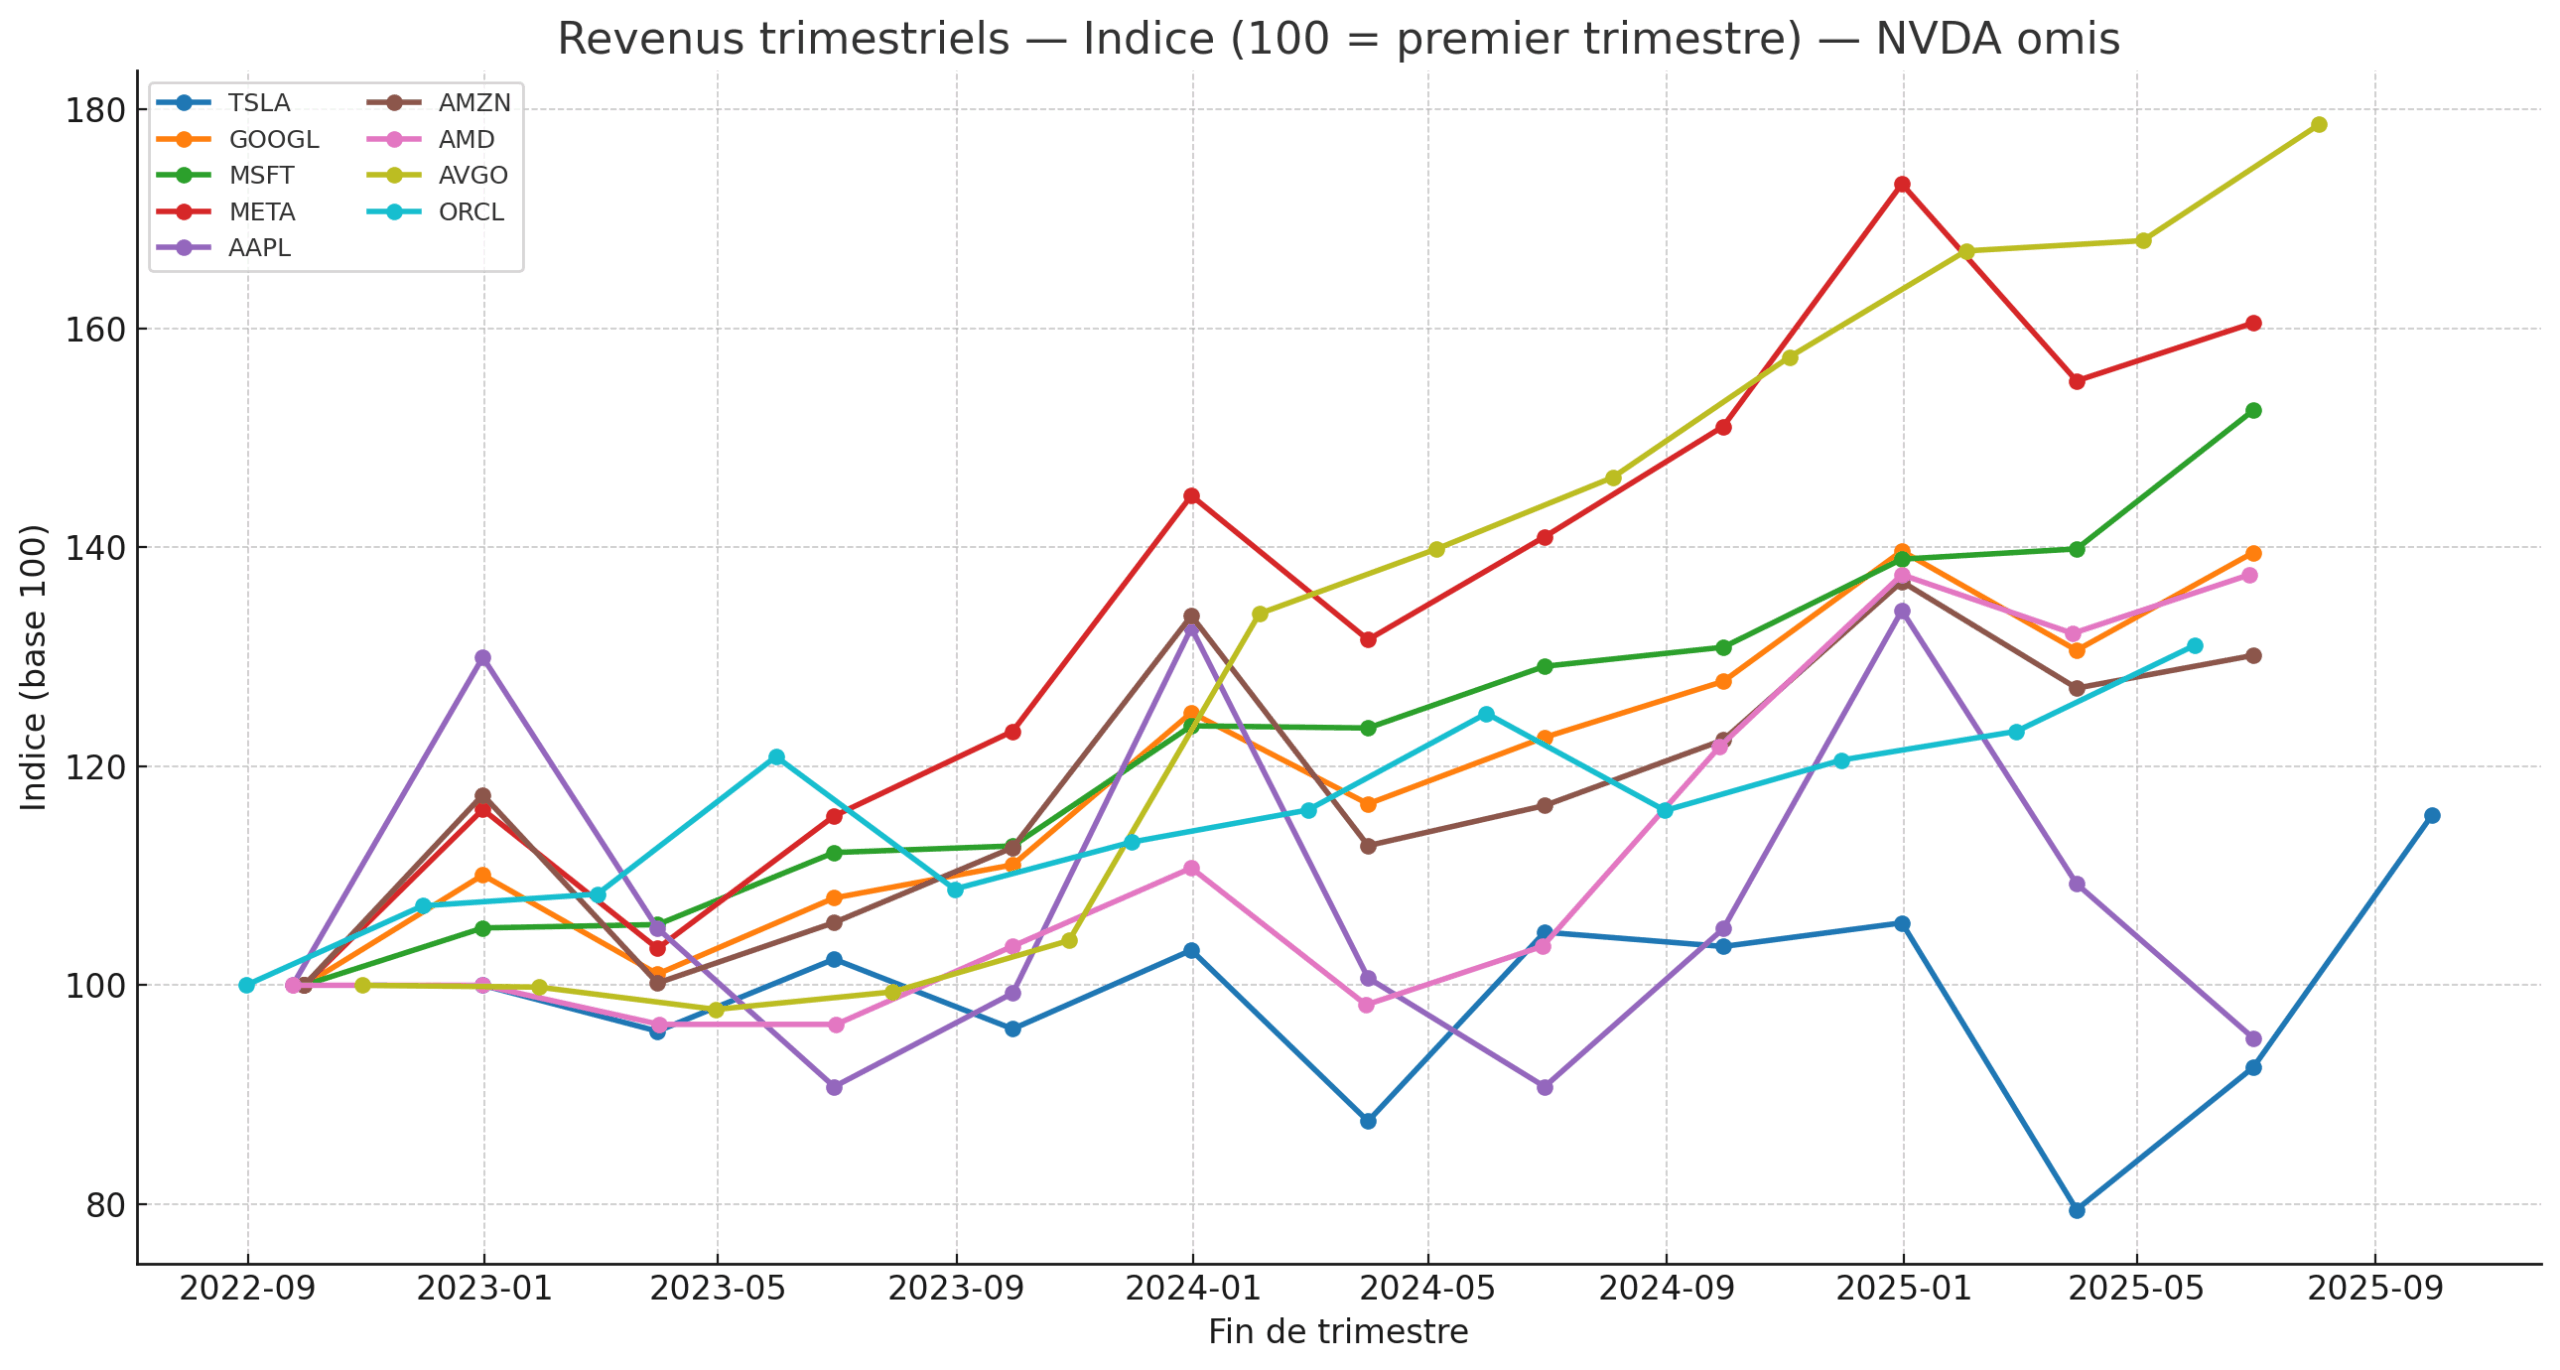
J’ai concentré tous les revenus de toutes les big techs sur un graphe : mais la croissance Nvidia fait disparaitre les details des autres !
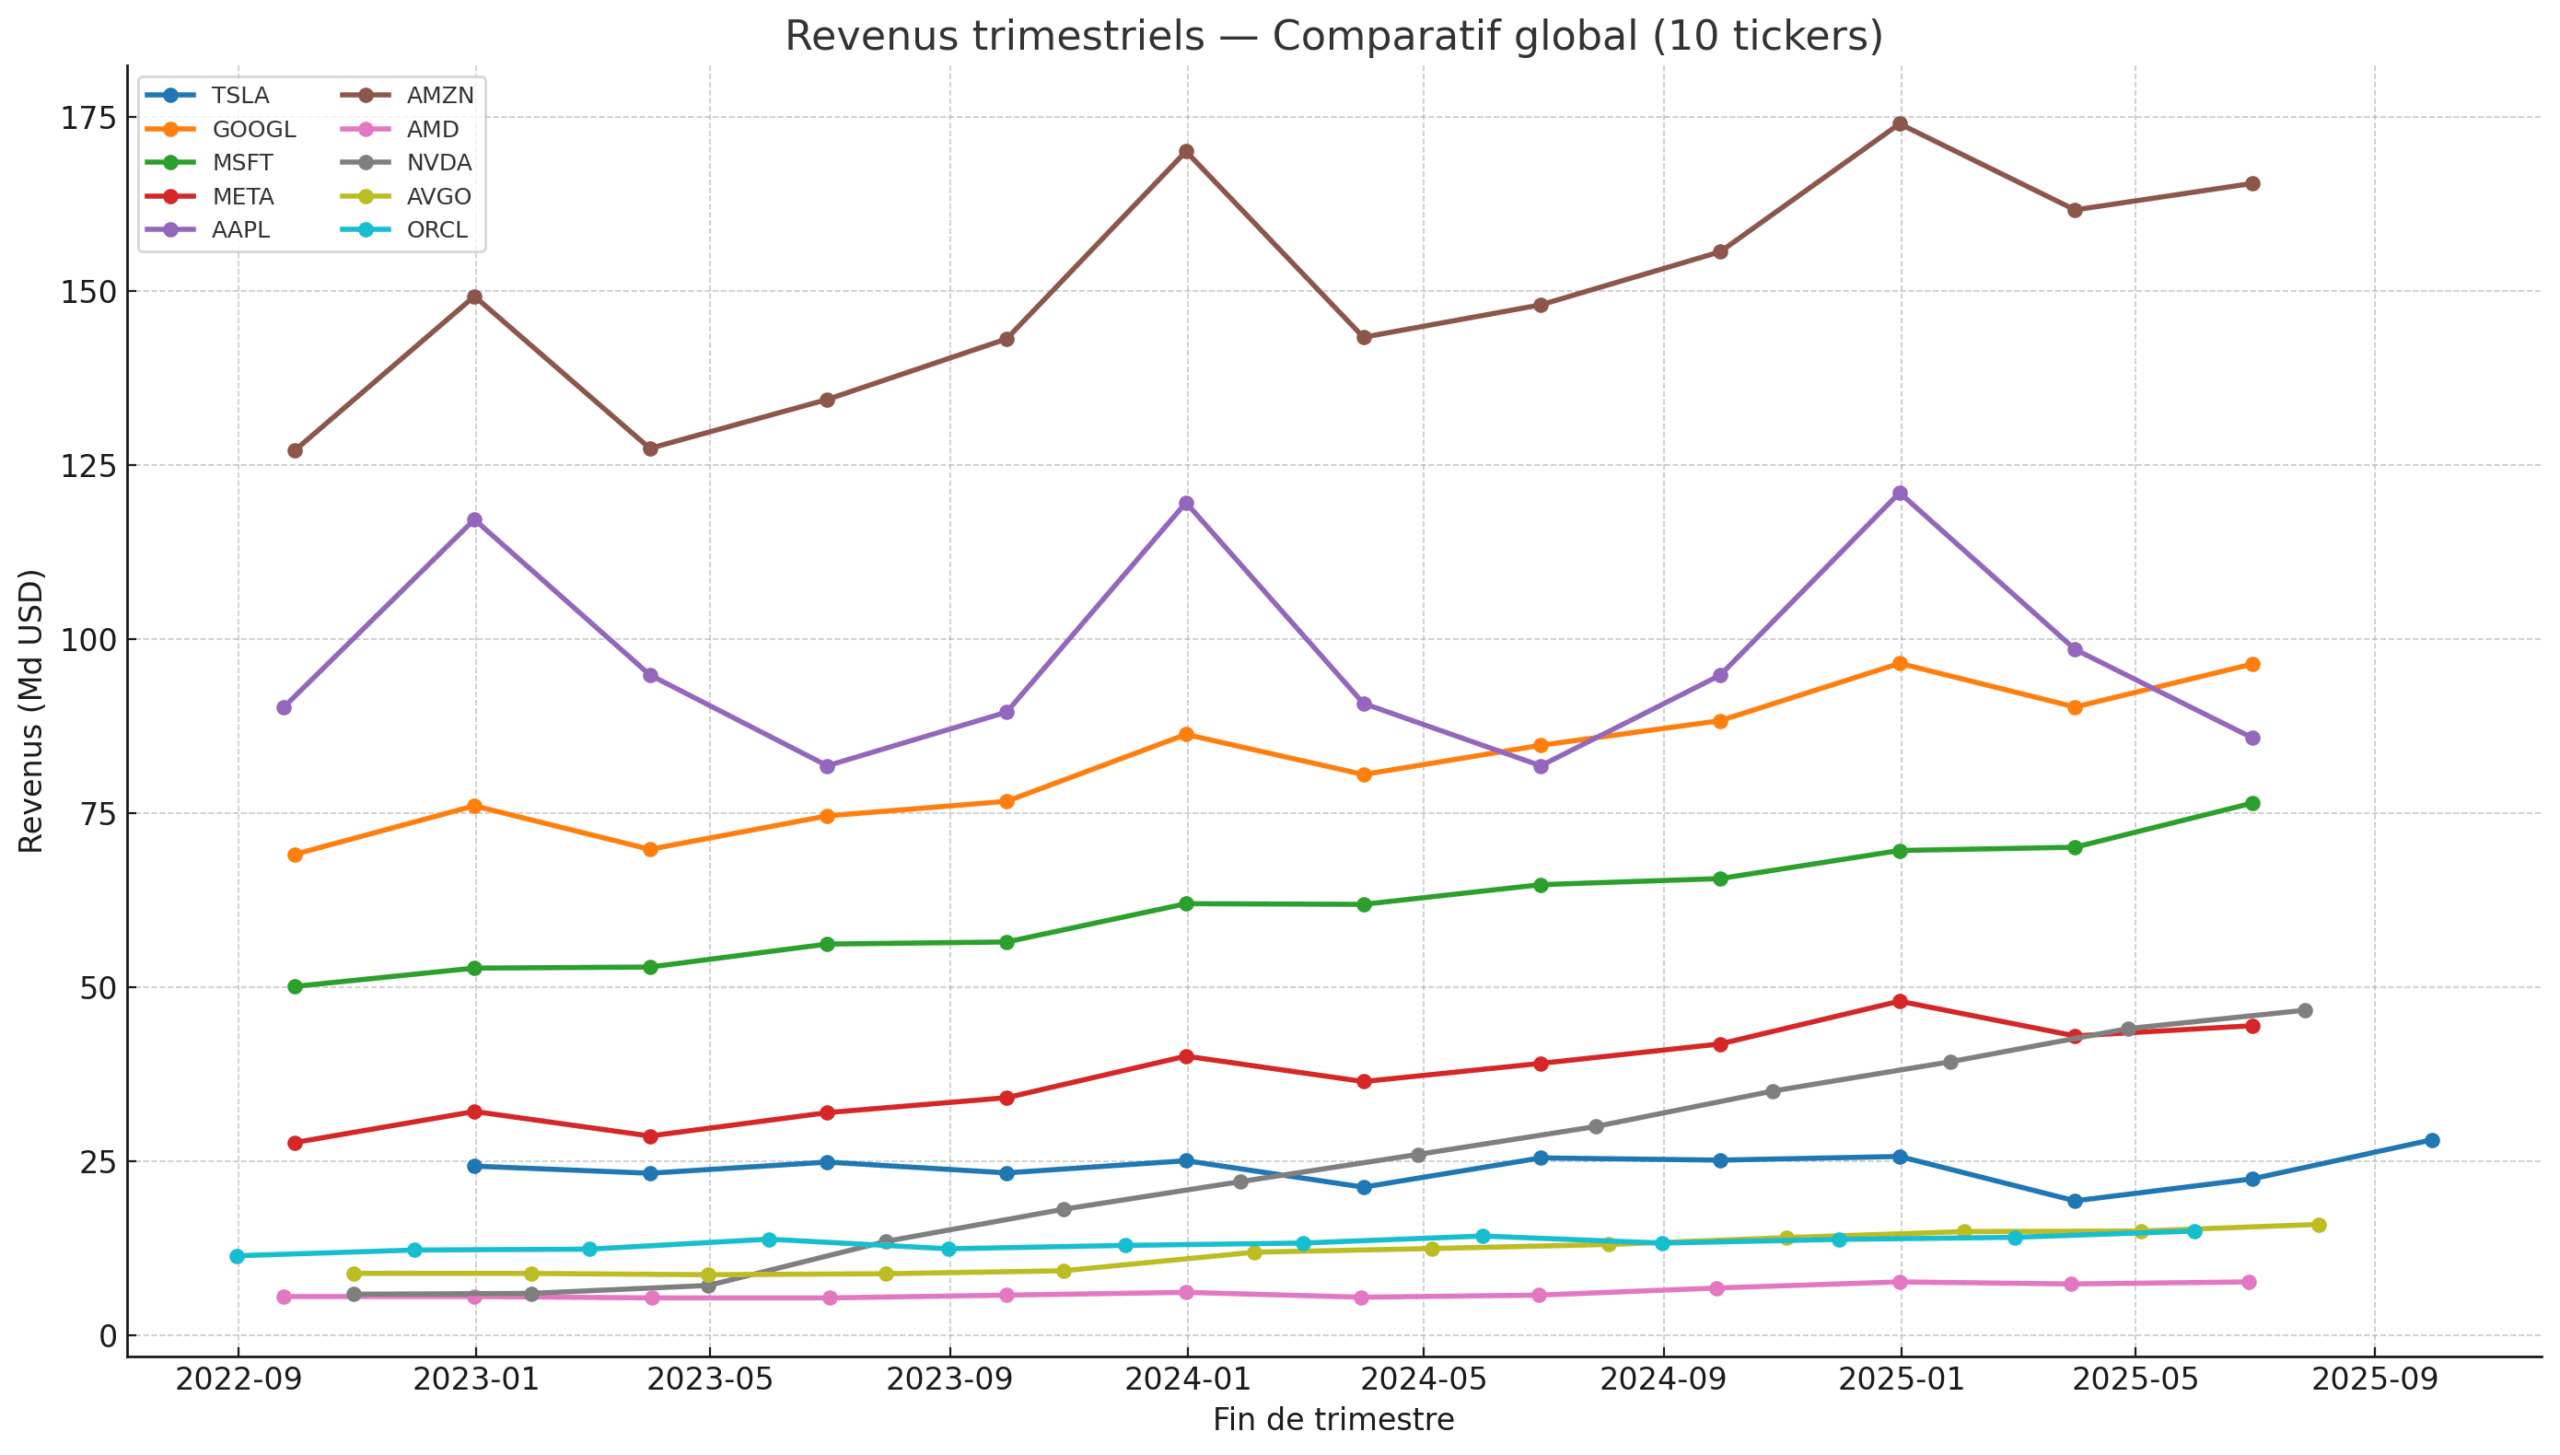
En voyant ces tableaux, on peut conclure que AMD, AVGO, ORCL, TSLA, AAP ont des progressions de revenus tres stables, ou faibles.
Les sociétés en croissance de revenus sont NVDA, AMZN, GOOGL, MSFT, META
– pour un profil investisseur long terme qui se base sur les fondamentaux uniquement, on devrait se concentrer uniquement sur ce dernier groupe.
– pour un profil trader, la volatilité sera recherchée, et donc plutot AMD, ORCL, AAPL..
Revenus/Cotations
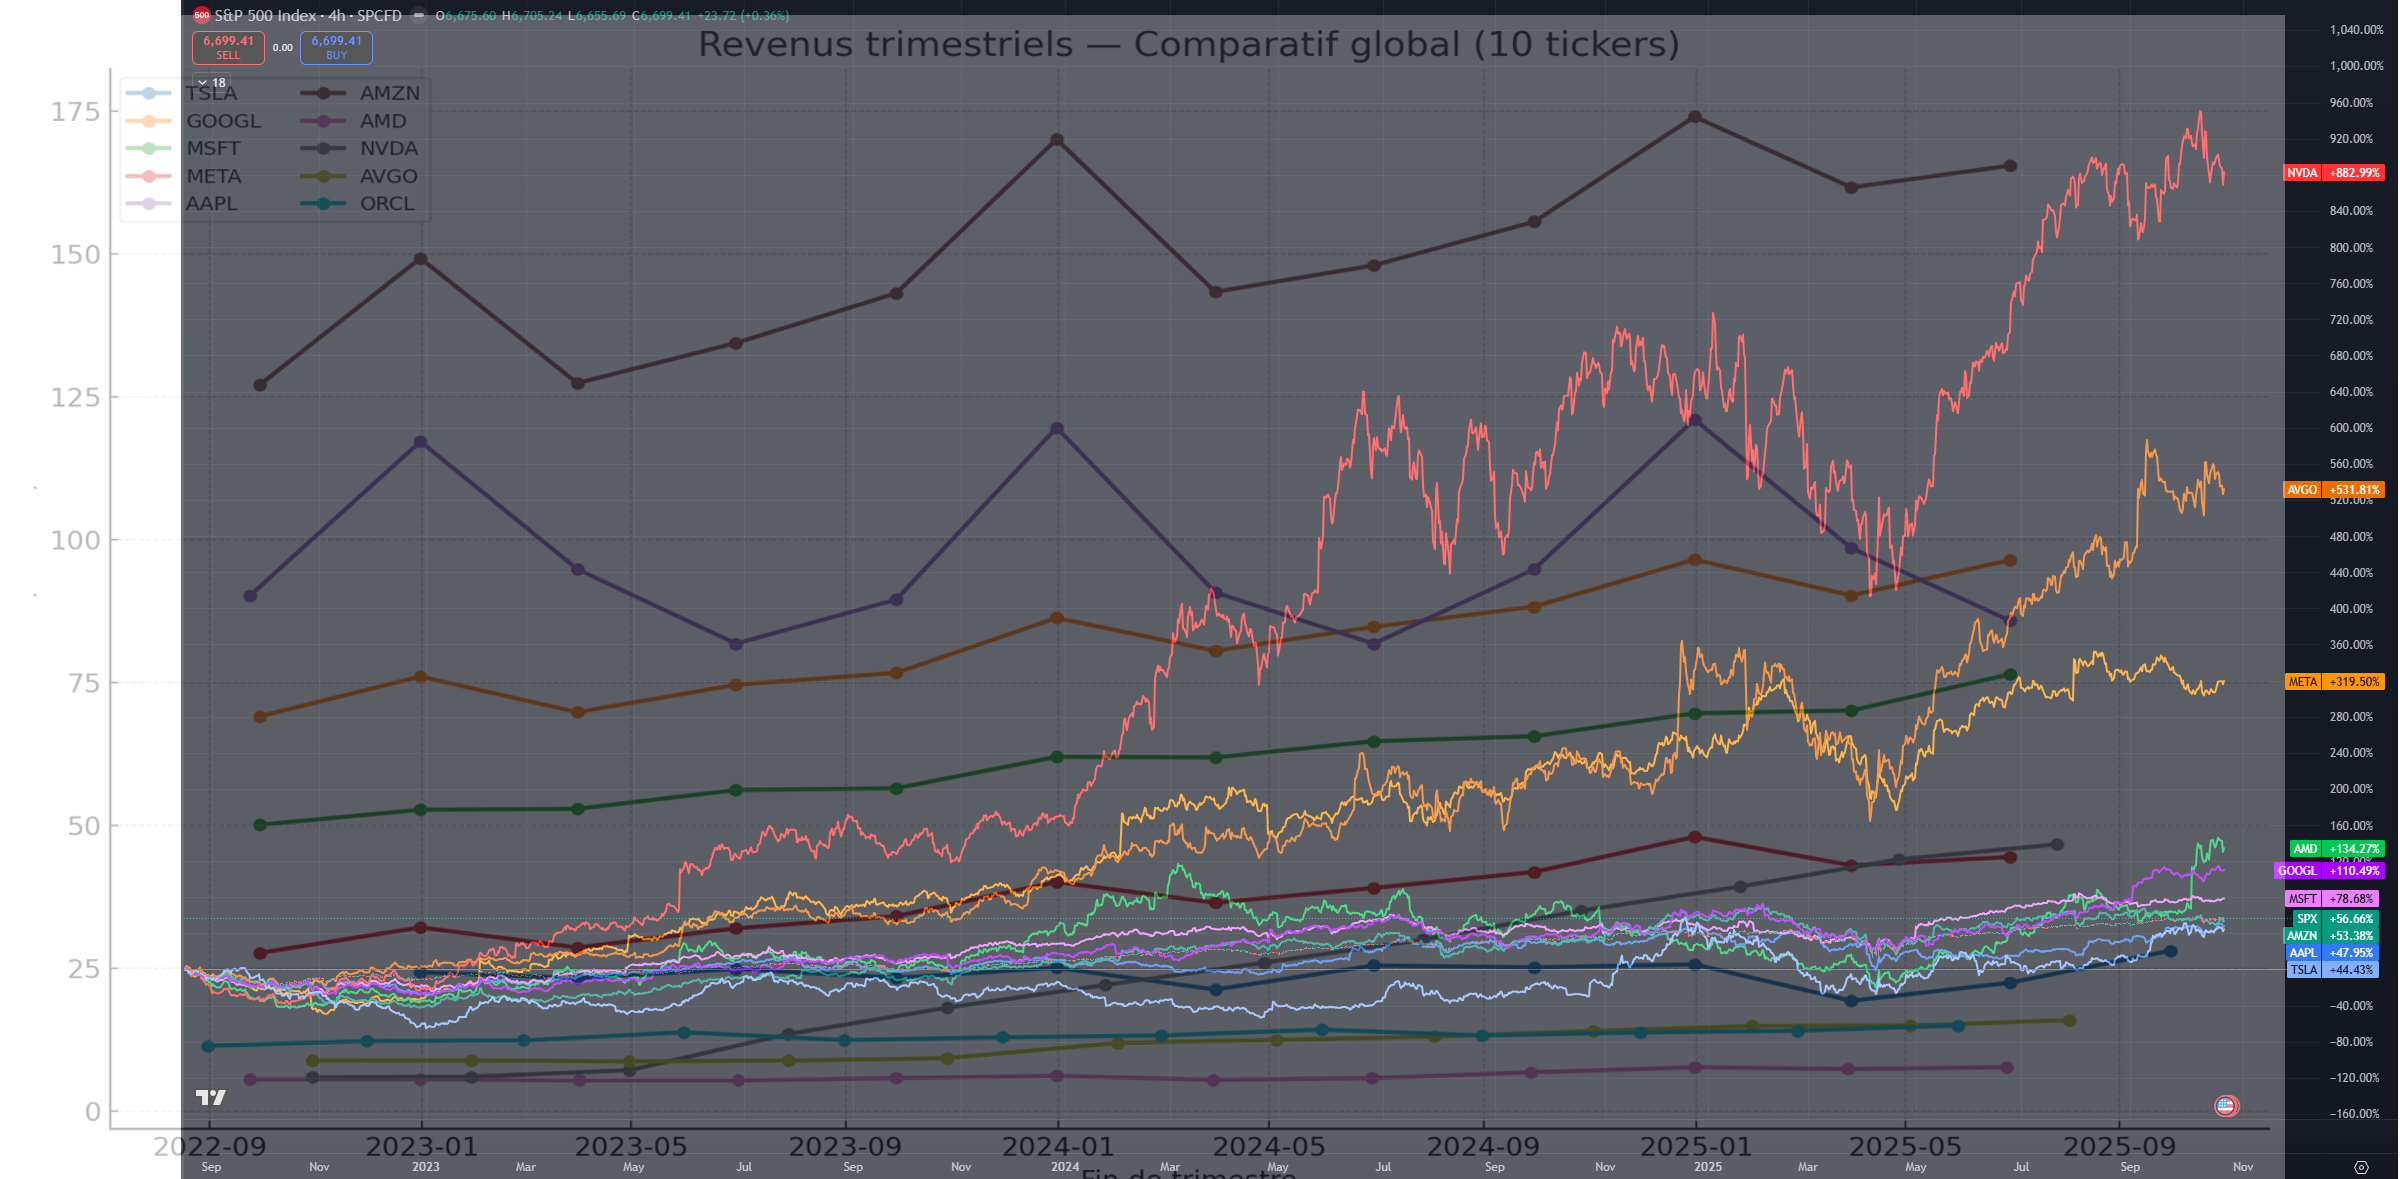
On ne peut que constater que la correlation revenus passés / cotation est tres faible – au mieux les 2 sont en augmentations.
La volatilité ne semble pas du tout liée aux revenus y compris pour AAPL qui est pourtant cyclique en termes de ventes (iphones) et de déclarations de CA.
Les attentes du marché priment sur la réalité comptable.
Si on analyse les 3 graphes, on s’apercoit que ceux qui sont en tete de croissance de revenus dans l’ordre :
NVDA, AVGO, META
…ont effectivement décolé en terme de cotations.
Quels sont les prochains (dans l’ordre) ?
MSFT, GOOGL, .. AMD qui revient de loin, AMZ, ORCL
Le seul en descente est AAPL, mais il est justement au point d’inflexion, et son cours vient de rebondir !
Le seul non régulier est aussi celui qui porte le plus de promesses su l’avenir et un PER associé : TSLA
Voici un tableau récapitulatif des estimations “prochain trimestre” (EPS & revenus) pour nos 10 tickers. Ce sont des consensus publics (gratuits) – ils évoluent fréquemment ; j’indique une source primaire par ligne.
| Ticker | EPS estimé (prochain trim.) | Revenu estimé (prochain trim.) | Source principale |
|---|---|---|---|
| TSLA | $0,41–0,46 | — | Nasdaq/Zacks page “Earnings” (consensus court terme). Nasdaq+1 |
| GOOGL | $2,27–2,29 | $84,6–84,7 Md | Nasdaq (EPS glissant) & Yahoo/ Zacks note revenus. Nasdaq+1 |
| MSFT | $3,61–3,65 | $75,0 Md (≈ $74,96 Md) | Zacks/Yahoo articles “reports next week”. Nasdaq+1 |
| META | $6,2–6,6 | $49,4 Md | Zacks detailed estimates + Yahoo article “expects”. Zacks+1 |
| AAPL | ≈ $1,74 | — | Yahoo Finance (notes d’analystes récentes). Yahoo Finance |
| AMZN | — | ≈ $177–178 Md (plage 174–179 Md) | Yahoo Finance “Analysis / Revenue estimate”. ca.finance.yahoo.com+1 |
| AMD | $1,17 | $8,7–9,1 Md | Yahoo earnings calendar + page “analysis”. Yahoo Finance+1 |
| NVDA | $1,24 | ≈ $54,6 Md | TipRanks “Forecast” (EPS & ventes). tipranks.com |
| AVGO | — | ≈ $17,4 Md (guidance/consensus) | TipRanks ventes + Reuters (guidance Q4). tipranks.com+1 |
| ORCL | $1,63–1,64 | ≈ $16,2 Md | Yahoo/Zacks note + SeekingAlpha/Nasdaq pages. Yahoo Finance+2seekingalpha.com+2 |
Remarques importantes
-
Les dates de publication sont parfois “estimées” par les agrégateurs (ex. NVDA 19 nov. 2025 “after close”). Vérifie la convocation IR quand elle tombe. tipranks.com+1
-
Les valeurs peuvent différer légèrement entre sites (méthodes d’agrégation différentes, GAAP vs non-GAAP, timing fiscal vs calendaire)
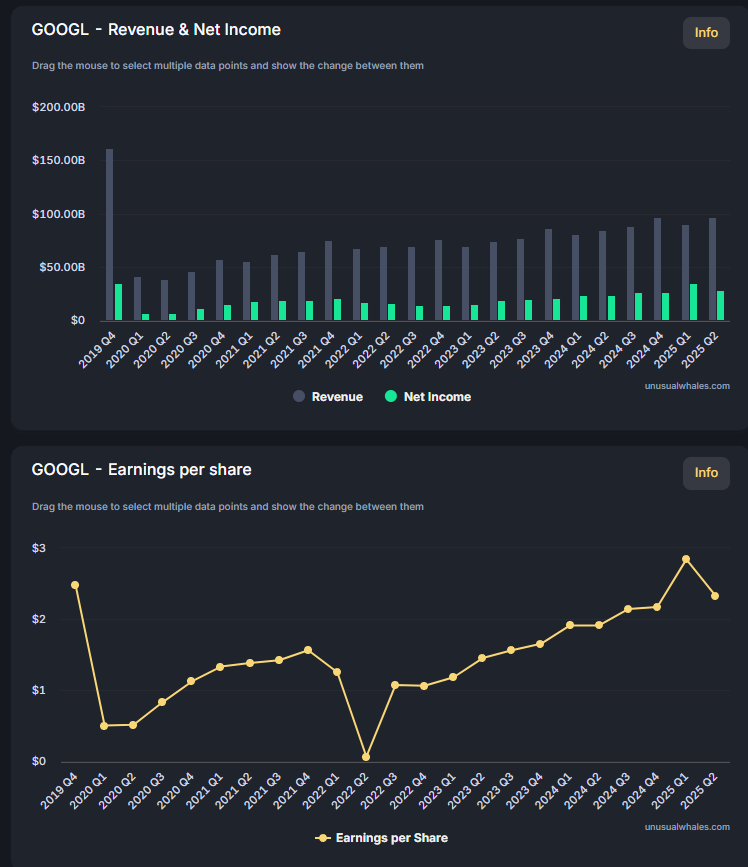
la courbe Revenues/Net income permet de voir les revenus et la manière dont ils sont convertis en net income, par ex s’il y’a des capex importantes, le net income va disparaitre dedans.
Capex = capital expenditures, je dirais « investissements ».
Plus d’informations
Palantir (PLTR) - 176.60 USD (20251023 15H) - Analyse complète - sortie avec retour en cas de chute sous les 90USD
📈 Performance récente et momentum
Palantir a dépassé les attentes au Q4 2024 avec une croissance du chiffre d’affaires de 36% en glissement annuel à 828 millions de dollars, marquant son sixième trimestre consécutif de croissance accélérée. Pour 2025, la société prévoit une croissance des revenus de 31% et guide vers 3.74-3.76 milliards de dollars de revenus annuels Palantir Soars 22% Pre-Market as Q4 Earnings and 2025 Outlook Impress +2.
🎯 Prévisions des analystes pour 2025
Croissance attendue :
- Les analystes prévoient une croissance des revenus de 45.3% pour atteindre 4.16 milliards en 2025, une révision à la hausse de 10 points par rapport aux estimations de mai IO Fund
- Wedbush prévoit une croissance de 22% des revenus et des marges bénéficiaires ajustées de 83.24% TheStreet
- Le segment commercial américain devrait croître d’au moins 54% en 2025 The Motley Fool
Objectifs de prix :
- Large éventail : de 45$ (bas) à 200$ (haut), avec une médiane à 158.39$ 24/7 Wall St.
- Bank of America : 125$ (relevé de 90
- (relevé de 60$) Yahoo Finance
- Wedbush (Dan Ives) : 90$ avec rating « outperform » TheStreet
💪 Catalyseurs de croissance
- Plateforme AIP (Artificial Intelligence Platform)
- Contrats gouvernementaux majeurs
- Contrat de 10 milliards sur 10 ans avec l’armée américaine, contrat de 1 milliard avec le ministère de la Défense britannique 24/7 Wall St.FinancialContent
- Expansion commerciale
- Revenus commerciaux US en hausse de 93% au Q2 2025, avec 69% d’augmentation du nombre de clients à 593 Yahoo FinanceInvesting.com
⚠️ Risques et préoccupations
- Valorisation extrême
- P/S forward de 104x – il faudrait plus de 100 ans pour récupérer la capitalisation boursière actuelle IO Fund
- P/E forward de 213-274x, impliquant qu’il faudrait près d’un demi-siècle pour récupérer l’investissement initial 24/7 Wall St.Yahoo Finance
- Défis internationaux
- Croissance internationale plus faible, potentiellement impactée par les régulations IA européennes FinancialContentFinancialContent
- L’Europe et l’Asie sont en retard dans l’adoption de l’IA par rapport aux États-Unis Ainvest
- Concentration et risques institutionnels
- La propriété institutionnelle n’est que de 53.78%, avec JPMorgan et T. Rowe Price réduisant leurs positions de 32% et 24% respectivement 24/7 Wall St.24/7 Wall St.
📊 Consensus du marché
Le consensus des 19 analystes est « Hold » (maintenir) avec 4 « Buy », 13 « Hold » et 2 « Sell » 24/7 Wall St.Nasdaq. Cette prudence reflète le dilemme entre :
- Les points forts : croissance accélérée, domination AIP, contrats gouvernementaux massifs
- Les inquiétudes : valorisation astronomique nécessitant une exécution parfaite
🔮 Scénarios pour 2025
Scénario haussier :
- Maintien de la croissance 30%+
- Nouveaux contrats gouvernementaux majeurs
- Adoption accélérée d’AIP dans le commercial
- Cours potentiel : 200$+ (cible haute Wedbush)
Scénario baissier :
- Décélération de la croissance après le pic du Q4
- Compression des multiples si déception
- Correction vers les niveaux de valorisation plus rationnels
- Cours potentiel : 45-100$ (cibles basses)
Verdict
Palantir présente un paradoxe classique : une entreprise exceptionnelle avec une croissance explosive et une position dominante en IA, mais à une valorisation qui défie la gravité. Les attentes sont si élevées que même une excellente performance pourrait décevoir. La prudence est de mise à ces niveaux de prix.
Tesla (TSLA) - 424.96 USD (20251023 15H) - Analyse complète - sortie avec surveillance debut 2026
📊 Résultats Q3 2025 – Performance mixte
Tesla a rapporté des revenus de 28.1 milliards $ (battant les attentes de 26.4 milliards), mais a manqué sur l’EPS avec 0.50$ ajusté vs 0.54-0.56$ attendu. Le bénéfice net a chuté de 37% à 1.37 milliard $. Les livraisons record de 497,099 véhicules ont été réalisées en partie grâce aux réductions de prix agressives Tesla (TSLA) Q3 2025 earnings report +2.
La marge brute automobile (hors crédits) est tombée à environ 16.5-17%, moins de la moitié du pic de 2021, reflétant la pression sur les prix pour maintenir les volumes MarketPulseTESLARATI.
🎯 Prévisions des analystes pour 2025
Objectifs de prix :
- Wedbush (Dan Ives) : 600$ avec rating « Outperform », Baird : 548
- Barclays : 350$ (relevé de 275$) avec rating « Equal Weight » TESLARATI
- Cantor Fitzgerald : 355$ avec rating « Buy » TipRanks
- Consensus moyen : ~365$ (impliquant une baisse potentielle de ~17% du prix actuel de 430$)
Projections financières :
- Revenus 2025 : 94.4 milliards $, 2026 : 107.8 milliards $ ParameterTipRanks
- Livraisons estimées : 1.61 million en 2025, 1.86 million en 2026 TipRanks
🚗 Catalyseurs clés – Robotaxi et FSD
Développement Robotaxi :
- Tesla prévoit de retirer les conducteurs de sécurité des véhicules robotaxi à Austin cette année et d’opérer dans 8-10 zones métropolitaines d’ici fin 2025 CNBCAxios
- Production du Cybercab (sans volant) prévue pour début 2026, avec Musk visant Q2 pour le début de production AxiosCNBC
- Objectif de production de 2-4 millions de Cybercabs annuellement, avec moins d’un million en 2027 montant à 7 millions d’unités opérationnelles d’ici 2030 RoboForexMedium
Full Self-Driving (FSD) :
- Service robotaxi lancé à Austin en juin 2025 avec conducteur de sécurité, expansion prévue dans d’autres villes américaines Tesla
- ARK Invest estime que le business robotaxi pourrait représenter ~90% de la valeur d’entreprise de Tesla d’ici 2029 Ark Invest
- Seulement 12% de la flotte Tesla actuelle paie pour FSD Supervised, montrant un potentiel de croissance significatif CNBC
💪 Points forts
- Segment Énergie en forte croissance
- Position financière solide
- Innovation produit
- Modèles plus abordables prévus pour H1 2025, attendant une croissance des ventes de 20-30% RoboForex
⚠️ Risques et défis majeurs
- Valorisation extrême
- P/E forward de 316x et P/E trailing de 263x, parmi les plus élevés du marché The Market Periodical
- Le stock trade actuellement ~17% au-dessus du consensus des analystes
- Pression sur les marges
- Marges brutes automobiles à la moitié de leur pic historique à cause des réductions de prix MarketPulse
- Dépenses opérationnelles en hausse de 50%, bénéfice opérationnel en baisse de 40% YoY CNBC
- Défis commerciaux
- Incertitudes réglementaires et techniques
- Les barrières législatives et technologiques restent significatives pour le déploiement des robotaxis Medium
- Historique de promesses non tenues de Musk sur les délais FSD
📈 Scénarios pour 2025-2026
Scénario haussier (Bull Case) :
- Cathie Wood (ARK) voit 2,600$ d’ici 2029, Dan Ives suggère ~550$ dans l’année à venir 24/7 Wall St.
- Succès du déploiement robotaxi, adoption accélérée FSD
- Croissance continue du segment énergie
Scénario de base :
- Consolidation autour de 400-450$
- Progrès graduel sur l’autonomie
- Maintien des marges sous pression
Scénario baissier (Bear Case) :
- Correction vers le consensus de 365$ voire moins
- Déceptions sur les délais robotaxi/FSD
- Compression continue des marges automobiles
- Impact de la fin des crédits d’impôt EV
Verdict
Tesla présente un profil risque/rendement complexe. L’entreprise est à un point d’inflexion critique où ses ambitions en IA/robotaxi doivent se matérialiser pour justifier sa valorisation extrême. Les résultats Q3 montrent une entreprise sacrifiant les marges pour la croissance, avec l’espoir que les technologies autonomes transformeront le modèle économique. Les investisseurs parient essentiellement sur la vision futuriste de Musk plutôt que sur les fondamentaux actuels.
RMBS (Rambus Inc.) - 96.56 USD (20251023 17H) - Analyse complète - surveiller / upside limité
Société de semi-conducteurs et mémoire
✅ Points positifs / catalyseurs
-
Rambus a publié pour le 2ᵉ trimestre 2025 un chiffre d’affaires GAAP de 172,2 M$, avec des revenus produits de 81,3 M$ (+43 % en glissement annuel). investor.rambus.com
-
Le secteur “mémoire / semi-conducteurs hautes performances / IA / data centers” est identifié comme un moteur de croissance pour Rambus. MarketWatch+1
-
Les analystes sont plutôt optimistes : certaines estimations de cours visent jusqu’à ~130 $ à moyen terme. Ticker Nerd+1
-
Le consensus “rating” est majoritairement “Achat”. MarketBeat+1
⚠️ Risques / points à surveiller
-
Même si Rambus affiche de belles croissances, les valorisations sont déjà élevées. Le potentiel “upside” (hausse) à partir du cours actuel semble modéré selon certains analystes. TipRanks+1
-
Le secteur des semi-conducteurs/mémoire est très cyclique, avec des risques liés à la chaîne d’approvisionnement, aux coûts, à la demande (data centers, IA) et à la concurrence.
-
Les attentes de croissance doivent se réaliser pour “justifier” la valorisation — si la croissance ralentit, la chute peut être plus rapide.
-
Le cours cible varie beaucoup entre analystes (de ~73$ à ~130$ selon sources). Cela montre l’incertitude. Ticker Nerd+1
📊 Synthèse des attentes chiffrées
-
Cible moyenne des analystes : ~100-107 $ (avec une fourchette de ~73$ à ~130$) selon différentes sources. Ticker Nerd
-
Certaines sources donnent un potentiel d’augmentation modeste (~2-3 %) à 12 mois pour certains analystes. MarketBeat+1
-
À plus long terme (vers 2028), Rambus prévoit des revenus ~963 M$ et un bénéfice net ~355 M$ selon un article. Yahoo Finance
🔍 Mon point de vue (risque vs opportunité)
-
Opportunité : Si Rambus continue de capter une forte demande dans les mémoires pour IA/data centers, la croissance peut être significative.
-
Risque : Le “upside” à court terme semble modéré selon les cibles actuelles — cela signifie que le rendement potentiel est limité tandis que le risque de déception reste élevé.
-
c’est un titre à “surveiller” de près (croissance, marges, contrats, mémoire + IA).
assets dans un scope proche : tech/electronic, marketcap >200 Mds
Micron Technology, Inc. (ticker: MU) - 206.71 USD (20251024 12H) - Analyse complète - surveiller / upside limité, gains deja capitalisés
✅ Company & Business Highlights
-
Micron is a major U.S.-based memory-chip manufacturer (DRAM, NAND, high-bandwidth memory, etc.). Wikipédia+2Schwab Network+2
-
It has strong exposure to AI/data‐center demand: memory chips for servers, high-bandwidth memory for GPUs, etc. For example, it raised its revenue forecast citing AI‐driven chip demand. Reuters+2Schwab Network+2
-
Financial metrics show improving profitability and balance sheet metrics: e.g., from Morningstar the P/E (~ 24.9) and a quick ratio ~ 1.71. Morningstar
📊 Analyst Expectations & Valuation
-
Analysts have an average price target around US$213.52 (based on 29 analysts) with a range up to ~$270 and down to ~$170. TipRanks
-
Other sources show a somewhat lower target: e.g., ~$193.73 average, with range from ~$84 up to ~$250. StockAnalysis+1
-
The consensus rating among many analysts is “Buy”. TipRanks+1
🔍 Recent Performance & Guidance
-
Micron reported a record revenue quarter: ~$9.3 billion, up ~37% year-over-year, driven by strong DRAM and AI/data-center demand. MarketWatch+1
-
For its next quarter (fiscal Q4) they projected revenue of ~$10.7 billion (±) and EPS ~US$2.50. MarketWatch+1
-
More recently, the company raised its forecast: revenue ~$11.2 billion and adjusted EPS ~$2.85, with improved gross margin (~44.5%) thanks to improved pricing. Reuters
🎯 Key Drivers & Risks
Drivers
-
AI/data-center memory demand: Strong tailwind for high-bandwidth memory, DRAM in servers as generative AI and large models ramp.
-
Pricing and margin recovery: Supply tightness + improved pricing = better margins for memory-chip makers.
-
U.S. manufacturing / geopolitics: Being U.S-based may help amid chip supply/security concerns and policy tailwinds.
Risks
-
Cyclicality of memory markets: Memory chips are notoriously cyclical — demand can collapse, pricing can suffer.
-
Competition & supply: Other global players, potential oversupply, or rapid technology shifts.
-
Geopolitical / trade risks: Memory chips are tied into global supply chains and tariff/regulation regimes (e.g., China).
-
Valuation risk: If expectations (for AI demand, pricing) don’t fully materialize, the stock may face downside.
🤔 My View / Expectations
Given all the above:
-
I expect Micron to continue benefiting from the AI/data-center memory boom in the near term.
-
If margins continue to improve and supply remains constrained, upside is plausible.
-
But the valuation already reflects a lot of the “good” scenario: if things go flat or deteriorate, that means risk.
-
Therefore, I’d treat this as a high-reward/high-risk type stock: you’re betting on a strong memory cycle plus AI tailwinds holding up.
🔍 Key Growth & Forecast Metrics
Revenue & EPS growth forecasts
-
According to Simply Wall St, analysts expect Micron’s earnings (EPS) to grow at ~ 16.4% per annum over the next 3 years, and revenue to grow at ~ 14.3% per annum. Simply Wall St
-
Alpha Spread estimates a 3-year revenue CAGR of ~ 16%. www.alphaspread.com
-
From MarketBeat: For fiscal year 2025, Micron reported EPS of ~$7.59 (trailing) and forecasts suggest growth to ~$10.67 per share next year (≈ 75% growth) in some scenarios. MarketBeat
-
For the near term:
-
Analysts expected Q3 (fiscal) revenue ~US$8.86 billion and adjusted EPS ~$1.61/share. Investopedia+2FinancialModelingPrep+2
-
For fiscal Q4: revenue guidance of ~$11.1–11.3 billion and adjusted EPS ~$2.78-2.92 according to one estimate. Smartkarma
-
Wedbush expects Q1 2026 EPS ~US$3.10/share, up from ~$2.96/share prior estimate. MarketBeat
-
Valuation and targets
-
According to TipRanks, the average 12-month price target is ~$211.85, with a range from ~$170 to ~$270. TipRanks
-
Alpha Spread gives a 1-year average price target of ~$177.22, range ~$86.86 to ~$262.50. www.alphaspread.com
-
Peer commentary: Some firms (e.g., Citi Research) suggest more bullish longer-term outcomes (e.g., EPS to ~$21 in 2026) if favourable memory-chip pricing and AI demand persist. MarketWatch
Margins / Pricing trends
-
A key metric: gross margin. One article noted that for Q4 the street expected ~46% gross margin, and guidance will be critical. MarketWatch
-
Micron raised its Q4 guidance (August 2025) for revenue to ~$11.2 billion (from ~$10.7 billion) and EPS to ~$2.85 (from ~$2.50), citing better pricing especially in DRAM. Reuters+1
✅ My Take & Expectations
Putting this together, here’s how I view Micron’s outlook:
-
The growth forecasts (≈ 14-16% revenue CAGR, ~16% EPS CAGR) reflect solid but not explosive growth over the next few years under base case assumptions.
-
The near-term numbers are stronger: growth in 2025/26 could be much higher depending on memory-chip pricing, AI demand, etc. Some scenarios assume EPS growth of 50-75% year-over-year in the near term.
-
The valuation (price targets ~US$180-$220 in 12 months) suggests the market is somewhat expecting these favourable conditions already.
-
The biggest upside lies in a “bull case” scenario: if memory pricing remains tight, AI demand grows strongly, margins improve significantly → then the more aggressive forecasts (e.g., EPS ~$20+ in 2026) could materialize.
-
The biggest risk: if memory pricing weakens (cyclical downturn), AI demand is slower than expected, or margins get compressed → then downside is meaningful because much is already baked into the stock.
⚠️ Key Risks & What To Watch
-
Monitor memory-chip pricing, especially DRAM and high-bandwidth memory (HBM) which are key for AI/data-centre demand.
-
Watch the gross margin guidance in upcoming earnings: if margins don’t improve or get worse, that would be a red flag.
-
Be alert to cyclical downturns in memory markets: they’re notorious for large swings.
-
Also keep track of supply-chain / geopolitics issues (e.g., trade restrictions, memory capacity build-outs) which can affect pricing and margin.
-
The valuation works only if the favourable scenario plays out; if not, the “base case” growth may already be factored in.
Cisco Systems, Inc. (CSCO) - $70.27 (20251024 13H) - Analyse complète - low growth / check CapEx to shift to AI
✅ Company & Business Highlights
-
Cisco is a major player in networking hardware and software: routers, switches, wireless access, security, collaboration & cloud-management solutions. GlobalData+3Cisco+3IT Pro+3
-
It serves enterprise, service provider, public-sector markets globally: networking infrastructure for large clients across industries. GlobalData+1
-
Recently, Cisco has been leaning into AI infrastructure / data-center networking opportunities. For example, the company said it secured over $1 billion in AI-infrastructure orders so far. FinancialModelingPrep+1
-
It is undergoing strategic shifts: expanding software, services, cloud/security-oriented business (to move beyond traditional hardware). Reuters
📊 Analyst Expectations & Valuation
-
Analyst consensus on Cisco is moderate: according to MarketBeat, average 12-month price target is around US$ 74.72, implying only ~5-6% upside from current levels. MarketBeat
-
Other sources: StockAnalysis suggests average price target around US$ 74.75, with range roughly US$ 63 to US$ 87. StockAnalysis
-
Analysts expect near-term growth: For example, for the quarter they estimated fiscal Q4 revenue ~US$ 14.62 billion and EPS ~$0.98/share, up ~12.6% year-over-year. TipRanks+1
-
For the full fiscal year (FY2025) Cisco raised its forecast: revenue expected ~$56.5-56.7 billion; adjusted EPS ~$3.77-3.79/share. Reuters+1
🔍 Recent Performance & Key Developments
-
In a recent quarter, Cisco reported networking-segment revenue of ~$7.63 billion (up ~12% y/y) for gear used in AI/data-centers. Barron’s+1
-
In May 2025 it raised its full-year outlook, citing stronger demand for its networking equipment from AI/data-center investments. Reuters
-
On the risk side: Some commentary suggests Cisco’s growth is modest and competitive pressures high; one analysis labeled it a “strong sell unless upcoming earnings deliver a significant positive surprise.” Seeking Alpha
🎯 Key Drivers & Risks
Drivers:
-
AI/data-center boom: As large cloud/data-center operators build out infrastructure, demand for high-performance networking gear should benefit Cisco.
-
Shift toward software & services: If Cisco successfully grows recurring-revenue parts of business, earnings can become more stable.
-
Network/security/observability demand: With increasing digitization & cybersecurity needs, Cisco’s offerings could be well-positioned.
Risks:
-
Slower growth: Many analyst targets imply only modest upside; if growth disappoints, valuation could suffer.
-
Hardware business exposure: A good portion of Cisco’s business remains hardware, which is cyclical and subject to supply-chain/competition risks.
-
Competitive pressure: In networking, software, cloud infrastructure, many players are fighting for share; margins could be challenged.
-
Execution risk: Shifting business model (hardware → software/services) always carries risk of execution, integration (e.g., acquisitions) and ROI.
🤔 My View / Expectations
-
Cisco appears to be in a transitional phase: It has a solid legacy business and is trying to pivot more strongly into growth areas (AI infrastructure, software, services).
-
In the base case, growth is likely to be modest (single-digit or low double-digit % in some segments) rather than explosive; the market seems to reflect this, given modest price-target upside.
-
The upside case exists if Cisco can accelerate its growth by capturing a meaningful share of the AI/data-center networking growth, and successfully boost its software/services mix — that could lead to multiple expansion or stronger earnings growth.
-
The downside is meaningful if hardware/end-market demand slows, competition eats into margin, or the software/services transition lags — since the upside appears limited under base assumptions.
📌 What to Watch Going Forward
-
The next quarterly results: compare actual vs guidance for revenue growth, margin expansion, and the portion of business coming from AI/data-centers.
-
Guidance for full-year: will Cisco raise again (a positive) or lower its outlook (a red flag).
-
The growth of recurring-revenue (software, services) vs one-time hardware sales.
-
Profitability / margin trends: hardware business often has lower margin than software; shift toward higher-margin segments matters.
-
Macro / competitive environment: enterprise IT spending, data-center CAPEX, networking gear supply-demand dynamics, tariffs/trade (Cisco has exposure).
-
Integration and realization of big acquisitions (for example, the acquisition of Splunk Inc.) and how these contribute to growth and margin expansion. (Cisco’s acquisition of Splunk is a strategic move into observability/security/AI data domains). Investopedia
📈 Key Financial Projections
From Cisco’s own guidance and analyst consensus:
-
For Fiscal Year 2026 (ending around July 2026):
-
Revenue is guided to US$59.0 billion to US$60.0 billion. investor.cisco.com+2Yahoo Finance+2
-
Non‐GAAP EPS is guided to US$4.00 to US$4.06. investor.cisco.com+1
-
GAAP EPS is guided to US$2.79 to US$2.91. investor.cisco.com+1
-
-
For the first quarter of FY2026:
-
Revenue: US$14.65 billion to US$14.85 billion. investor.cisco.com+1
-
Non‐GAAP EPS: US$0.97 to US$0.99. investor.cisco.com+1
-
-
For FY2025 (recent full year) results:
What this implies:
-
Cisco is projecting revenue growth of about 4-6% from FY25 to FY26.
-
EPS growth (non‐GAAP) is guided to be ~5-7% year-over-year in the base case.
-
The company is emphasising margin and operating leverage, with commentary about recurring revenue (subscriptions/software) and large AI-/data-centre related orders. Q4cdn+1
💡 Valuation Context & Implied Upside
-
Current (approx) share price: ~US$70.27.
-
Using the non‐GAAP EPS guidance of ~US$4.00 (FY26) → forward P/E ~ 70.27 / 4.00 ≈ 17.6×.
-
If you assume the midpoint revenue of US$59.5 billion and growth remains ~5%+, that’s somewhat modest growth for a tech/infrastructure company.
-
Analyst consensus price target: ~US$74.72 (which implies limited upside in the near term) according to MarketBeat. MarketBeat+1
-
Given the guidance and growth, the valuation is somewhat conservative in terms of upside, unless the company accelerates growth materially or margin expansion surprises.
🔍 Risks & Upside Scenarios
Upside potential if Cisco:
-
Captures a much larger share of the AI/data‐centre networking boom: e.g., orders scale beyond the current >US$2 billion level in AI infra. Q4cdn+1
-
Successfully shifts its business mix toward higher-margin software and services (improving recurring revenue).
-
Delivers margin expansion (e.g., gross margin, operating margin) faster than guided.
-
Secures favourable tariffs/trade resolution which lowers cost pressure (tariffs were highlighted by Cisco in guidance). Q4cdn
Risks / limitations:
-
Growth remains modest (single‐digit percentage) which may limit multiple expansion.
-
Hardware/networking business remains subject to cyclicality, competition, and macro IT spend weakness.
-
If software/services transition lags, or if enterprise IT budgets slow (which Cisco flagged).
-
If margins don’t expand or tariffs/trade cost pressures worsen.
🧮 My View / Summary
-
In the base case, Cisco looks like a stable infrastructure/tech stock with decent cash flows and modest growth (~5-7% EPS growth) but not explosive growth.
-
At ~17-18× forward P/E, that suggests the market is pricing in modest growth → so upside may be limited unless Cisco outperforms.
-
If Cisco can accelerate growth (say high‐teens CAGR) and achieve margin gains, then there is meaningful upside.
-
Conversely, if growth or margin disappoint, the stock could underperform given the limited discount in valuation.
-
For an investor, this might be a more conservative “steady growth / dividend / buyback” type holding rather than a high-flyer.
RTX Corp (ticker: RTX) - 179.44 USD (20251024 13H) - Analyse complète - upside limité
✅ Company & Business Highlights
-
RTX is a large U.S.-based aerospace & defence conglomerate, formed via the merger of Raytheon Technologies Corporation and the aerospace operations of United Technologies Corporation. Wikipédia+2GlobalData+2
-
It operates through three major business units:
-
Pratt & Whitney: aircraft engines and related business. rtx.com+1
-
Collins Aerospace: aerospace systems and components. GlobalData
-
Raytheon (defence segment): missiles, air-defence, military electronics. Wikipédia+1
-
-
Its exposure is both commercial aerospace (engines, aircraft subsystems) and military/defence systems. This mix gives a diversification but also links it to cyclical demand in aviation and steady defence budgets. Yahoo Finance
-
According to Simply Wall St, the company is forecast to grow earnings at ~11.5% per annum and revenue at ~4.9% per annum over the next ~3 years. Simply Wall St
📊 Analyst Expectations & Valuation
-
Analyst consensus: Many analysts rate RTX as a Buy or Moderate Buy. TipRanks+1
-
Price targets:
-
One source shows an average 12-month price target of about US$175-180 (range up to around US$200). Ticker Nerd+1
-
Another gives average targets nearer US$164.46 (+~4% upside) based on 14 analysts. StockAnalysis
-
A more conservative set shows average targets ~US$165 with a downside or limited upside. MarketBeat
-
-
Growth expectations: EPS growth ~12-16% per year; revenue growth more modest (~4-5%). Simply Wall St+1
🔍 Recent Performance & Key Developments
-
RTX reported that commercial aviation demand is improving (air travel recovering) and defence demand remains robust (geopolitical tensions). For example: backlog of >US$200 billion for commercial + defence orders. MarketWatch
-
On the flip side: they cut their 2025 profit forecast due to tariffs and cost pressures, even while raising sales guidance. For instance, adjusted EPS expected ~$5.80-5.95 vs prior ~$6.00-6.15. Reuters
-
There are also legacy/legal issues: For example, RTX agreed to pay ~US$950 million to resolve bribery/fraud claims related to prior businesses. AP News
🎯 Key Drivers & Risks
Drivers
-
Strong defence spending globally: As militaries modernize and increase procurement of missiles, radar systems, etc, RTX is positioned to benefit.
-
Commercial aerospace recovery: As more aircraft fly, maintenance and engine demand (Pratt & Whitney) improves.
-
Backlog: Large backlog gives revenue visibility and potential for growth.
Risks
-
Commercial aviation remains cyclical: If travel or aircraft production lags, the engine/airframe side may suffer.
-
Cost pressures / supply chain: Tariffs, raw material costs, engine inspection issues (in past) add risk.
-
Defence business risk: While steadier, it is subject to government budget/contracting cycles, regulatory scrutiny.
-
Valuation risk: With only modest revenue growth expected, if expectations slip, upside may be limited.
🤔 My View / Expectations
Putting this together:
-
RTX seems like a steady, industrial/defence play rather than a high-flying growth stock.
-
If defence budgets stay strong and aviation continues recovery, the business should do reasonably well.
-
But the modest revenue growth (~5%/yr) and limited near-term upside in many analyst targets suggest that much of the “good news” may already be factored in.
-
Therefore, upside appears modest (perhaps ~10-15%) in the base case, with bigger upside only if major positive surprises occur (e.g., big new defence contracts, faster aviation recovery).
-
Conversely, downside exists if any of the risks (cost pressure, aviation slowdown, contract delays) materialize.
ANNEXES
| date | quarter | TSLA | GOOGL | MSFT | META | AAPL | AMZN | AMD | NVDA | AVGO | ORCL |
|---|---|---|---|---|---|---|---|---|---|---|---|
| 2022-08-31 | 2022Q3 | 11.445 | |||||||||
| 2022-09-24 | 2022Q3 | 90.146 | 5.600 | ||||||||
| 2022-09-30 | 2022Q3 | 69.092 | 50.122 | 27.714 | 127.101 | ||||||
| 2022-10-30 | 2022Q4 | 5.930 | 8.930 | ||||||||
| 2022-11-30 | 2022Q4 | 12.276 | |||||||||
| 2022-12-31 | 2022Q4 | 24.320 | 76.050 | 52.747 | 32.165 | 117.154 | 149.204 | 5.600 | |||
| 2023-01-29 | 2023Q1 | 6.050 | 8.915 | ||||||||
| 2023-02-28 | 2023Q1 | 12.398 | |||||||||
| 2023-03-31 | 2023Q1 | 23.300 | 69.800 | 52.900 | 28.645 | 94.836 | 127.358 | ||||
| 2023-04-01 | 2023Q2 | 5.400 | |||||||||
| 2023-04-30 | 2023Q2 | 7.190 | 8.733 | ||||||||
| 2023-05-31 | 2023Q2 | 13.836 | |||||||||
| 2023-06-30 | 2023Q2 | 24.900 | 74.604 | 56.200 | 32.000 | 81.797 | 134.383 | ||||
| 2023-07-01 | 2023Q3 | 5.400 | |||||||||
| 2023-07-30 | 2023Q3 | 13.510 | 8.876 | ||||||||
| 2023-08-31 | 2023Q3 | 12.451 | |||||||||
| 2023-09-30 | 2023Q3 | 23.350 | 76.693 | 56.500 | 34.146 | 89.498 | 143.083 | 5.800 | |||
| 2023-10-29 | 2023Q4 | 18.120 | 9.295 | ||||||||
| 2023-11-30 | 2023Q4 | 12.941 | |||||||||
| 2023-12-31 | 2023Q4 | 25.100 | 86.300 | 62.000 | 40.111 | 119.575 | 170.000 | 6.200 | |||
| 2024-01-28 | 2024Q1 | 22.100 | |||||||||
| 2024-02-04 | 2024Q1 | 11.961 | |||||||||
| 2024-02-29 | 2024Q1 | 13.277 | |||||||||
| 2024-03-30 | 2024Q1 | 5.500 | |||||||||
| 2024-03-31 | 2024Q1 | 21.301 | 80.539 | 61.900 | 36.462 | 90.753 | 143.313 | ||||
| 2024-04-28 | 2024Q2 | 26.000 | |||||||||
| 2024-05-05 | 2024Q2 | 12.487 | |||||||||
| 2024-05-31 | 2024Q2 | 14.287 | |||||||||
| 2024-06-29 | 2024Q2 | 5.800 | |||||||||
| 2024-06-30 | 2024Q2 | 25.500 | 84.740 | 64.727 | 39.069 | 81.797 | 147.968 | ||||
| 2024-07-28 | 2024Q3 | 30.000 | |||||||||
| 2024-08-04 | 2024Q3 | 13.072 | |||||||||
| 2024-08-31 | 2024Q3 | 13.272 | |||||||||
| 2024-09-28 | 2024Q3 | 6.819 | |||||||||
| 2024-09-30 | 2024Q3 | 25.182 | 88.270 | 65.600 | 41.862 | 94.803 | 155.584 | ||||
| 2024-10-27 | 2024Q4 | 35.100 | |||||||||
| 2024-11-03 | 2024Q4 | 14.054 | |||||||||
| 2024-11-30 | 2024Q4 | 13.800 | |||||||||
| 2024-12-31 | 2024Q4 | 25.707 | 96.500 | 69.632 | 48.000 | 121.000 | 173.960 | 7.700 | |||
| 2025-01-26 | 2025Q1 | 39.300 | |||||||||
| 2025-02-02 | 2025Q1 | 14.920 | |||||||||
| 2025-02-28 | 2025Q1 | 14.100 | |||||||||
| 2025-03-29 | 2025Q1 | 7.400 | |||||||||
| 2025-03-31 | 2025Q1 | 19.335 | 90.234 | 70.100 | 43.015 | 98.500 | 161.600 | ||||
| 2025-04-27 | 2025Q2 | 44.060 | |||||||||
| 2025-05-04 | 2025Q2 | 15.004 | |||||||||
| 2025-05-31 | 2025Q2 | 15.000 | |||||||||
| 2025-06-28 | 2025Q2 | 7.700 | |||||||||
| 2025-06-30 | 2025Q2 | 22.496 | 96.400 | 76.441 | 44.480 | 85.800 | 165.400 | ||||
| 2025-07-27 | 2025Q3 | 46.700 | |||||||||
| 2025-08-03 | 2025Q3 | 15.952 | |||||||||
| 2025-09-30 | 2025Q3 | 28.095 | |||||||||
| Unités : milliards USD (valeurs vides = données non disponibles pour ce trimestre). | |||||||||||
